AbsorptionRatio_AutoRiskPanel
Chỉ báo
Phiên bản 1.0, Dec 2025
Windows, Mac
5.0
Đánh giá: 1
Mô tả
AbsorptionRatio_AutoRiskPanel biến đổi bất kỳ ký hiệu cTrader nào thành một bảng điều khiển chế độ rủi ro trực tiếp 🛰️.
Thay vì dựa vào nhiều ETF như Absorption Ratio đa tài sản gốc, chỉ báo này xây dựng một đại diện AR đơn ký hiệu trực tiếp từ hành động giá của công cụ bạn đang giao dịch:
- 📉 Nó tính toán lợi nhuận logarit của ký hiệu hiện tại.
- 🔗 Nó đo lường tự tương quan của lợi nhuận qua nhiều độ trễ (1…7 thanh, tùy thuộc vào khoảng thời gian tương quan).
- 📊 Nó tổng hợp tự tương quan tuyệt đối trung bình và ánh xạ nó vào một Absorption Ratio chuẩn hóa từ 0,5 đến 1,0 — giá trị cao hơn có nghĩa là sự tập trung nhiều hơn và hành vi chặt chẽ hơn.
- 🧬 Nó làm mượt tín hiệu thô bằng EMA, tạo ra một đường cong AR ổn định.
- 🧪 Trong một khoảng nhìn lại thống kê, nó tính toán:
-
- trung bình và độ lệch chuẩn của AR
- Z-Score hiện tại (bao nhiêu σ trên/dưới trung bình)
- thứ hạng phần trăm của AR hôm nay so với lịch sử
- 🤖 Với Ngưỡng Tự Động được bật, chỉ báo liên tục tự hiệu chỉnh các mức rủi ro:
-
- Rủi ro thấp ≈
trung bình − 0,5σ - Rủi ro cao ≈
trung bình + 0,5σ - Rủi ro cực đoan ≈
trung bình + 1,5σ
Giá trị được giới hạn trong[0…1]và cập nhật từng thanh, vì vậy các chế độ thích ứng với từng ký hiệu và khung thời gian.
- Rủi ro thấp ≈
- 🧱 Từ các ngưỡng này, AbsorptionRatio_AutoRiskPanel xác định bốn chế độ động:
-
- THẤP → môi trường phân tán, dễ chịu / rủi ro thấp
- BÌNH THƯỜNG → điều kiện cân bằng / trung lập
- CAO → tập trung cao, xu hướng rủi ro cao
- CỰC ĐOAN → môi trường căng thẳng, khả năng tăng rủi ro hệ thống 🛑
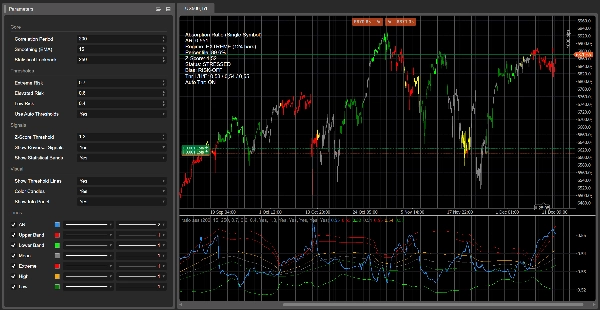
- 🕯️ Trên biểu đồ chính, nến có thể được mã màu theo rủi ro:
Điều này cung cấp cho bạn một bộ lọc trực quan ngay lập tức: ví dụ, chỉ giao dịch các điểm vào xu hướng khi nến không có màu đỏ/cam, hoặc giảm kích thước trong các chế độ căng thẳng. -
- 🔴 Đỏ → AR bị căng thẳng về mặt thống kê (Z-Score ≥ ngưỡng)
- 🟢 Xanh chanh → AR bình tĩnh về mặt thống kê (Z-Score ≤ −ngưỡng)
- 🟧 / 🟡 Cam/Vàng → trên mức Cao / gần Cực Đoan
- ⚪ Xám → vùng trung lập
- 💚 Xanh lá → AR thấp, hành vi phân tán hơn / rủi ro thấp
- 🎯 Tùy chọn tín hiệu hồi quy trung bình trong bảng AR:
-
- 🟢 Mũi tên mua khi AR bình tĩnh về mặt thống kê và bắt đầu tăng lên
- 🔴 Mũi tên bán khi AR bị căng thẳng về mặt thống kê và bắt đầu giảm xuống
- 📋 Một bảng thông tin nhỏ gọn ở góc trên bên trái hiển thị:
-
- giá trị AR hiện tại
- Chế độ đang hoạt động + thời gian (số thanh đã ở trong chế độ này)
- Phần trăm, Z-Score và Trạng thái định tính (BỊ CĂNG THẲNG / BÌNH TĨNH / BÌNH THƯỜNG)
- Thiên hướng rủi ro (RỦI RO-ON / RỦI RO-OFF / TRUNG LẬP)
- các ngưỡng Thấp / Cao / Cực Đoan hiệu quả được sử dụng và liệu Ngưỡng Tự Động có bật hay tắt
Sử dụng AbsorptionRatio_AutoRiskPanel để:
- tránh giao dịch trong các chế độ rủi ro-off, bị căng thẳng về mặt thống kê
- xác định môi trường bình tĩnh nơi các đột phá hoặc theo xu hướng có thể hoạt động tốt hơn
- đặt bất kỳ chiến lược nào vào trong một khung chế độ rủi ro động thay vì sử dụng các bộ lọc biến động cố định.
⚙️ Tham số (tài liệu lưu trữ)
Cốt lõi ⚙️
- Khoảng thời gian tương quan – Độ dài cửa sổ tự tương quan. Kiểm soát lượng lịch sử được sử dụng để ước tính Absorption Ratio. Giá trị lớn hơn = chế độ “macro” mượt mà hơn; giá trị nhỏ hơn = nhanh hơn nhưng ồn hơn.
- Làm mượt (EMA) – Khoảng thời gian EMA áp dụng cho tín hiệu AR thô. Giá trị cao hơn làm mượt thay đổi chế độ, giá trị thấp hơn làm chỉ báo phản ứng nhanh hơn.
- Khoảng nhìn lại thống kê – Khoảng thời gian nhìn lại cho trung bình AR, độ lệch chuẩn, Z-Score và phần trăm. Quy định tốc độ thích ứng của cơ sở thống kê.
Ngưỡng 🚦
- Rủi ro cực đoan / Rủi ro cao / Rủi ro thấp – Ngưỡng thủ công cho các chế độ AR (THẤP / BÌNH THƯỜNG / CAO / CỰC ĐOAN) được sử dụng khi Ngưỡng Tự Động tắt. Khi bật tự động, chúng bị bỏ qua về logic và chỉ hiển thị mặc định.
- Sử dụng Ngưỡng Tự Động – Khi bật, các ngưỡng được lấy từ thống kê AR cuộn:
-
- Rủi ro thấp = trung bình − 0,5σ
- Rủi ro cao = trung bình + 0,5σ
- Rủi ro cực đoan = trung bình + 1,5σ
Tín hiệu 🎯
- Ngưỡng Z-Score – Z-Score tuyệt đối tối thiểu để phân loại AR là cực đoan về mặt thống kê. Điều khiển nhãn BỊ CĂNG THẲNG/BÌNH TĨNH, ghi đè nến và mũi tên hồi quy trung bình.
- Hiển thị tín hiệu đảo chiều – Bật/tắt mũi tên MUA/BÁN trong cửa sổ phụ AR.
- Hiển thị dải thống kê – Bật/tắt dải ±2σ và đường trung bình quanh AR.
Hình ảnh 🎨
- Hiển thị đường ngưỡng – Hiển thị các mức Thấp / Cao / Cực Đoan hiệu quả được sử dụng bởi bộ máy chế độ (thủ công hoặc tự động).
- Tô màu nến – Tô màu nến giá theo Z-Score và mức chế độ để trực quan hóa rủi ro ngay lập tức.
- Hiển thị bảng thông tin – Hiển thị bảng văn bản ở góc trên bên trái với AR, chế độ, thống kê và thiên hướng.
Tóm tắt
Hồ sơ chỉ báo
Đánh giá của khách hàng
5.0
Đánh giá: 1
5 | 100 % | |
4 | 0 % | |
3 | 0 % | |
2 | 0 % | |
1 | 0 % |
Đánh giá của khách hàng
December 20, 2025
the cleanest use is it makes weak ideas easier to leave alone, and It should stay in the support stack.
Thảo luận
Câu hỏi thường gặp
Signal
Indices
Commodities
GBPUSD
RSI
Bollinger
Fibonacci
Scalping
AI
XAUUSD
NAS100
MACD
BTCUSD
Forex
Breakout
EURUSD
NZDUSD
Martingale
Prop
ZigZag
Supertrend
Fair Value Gap
SMC
Crypto
Grid
Stocks
ATR
USDJPY
VWAP
Các sản phẩm có sẵn trên cTrader Store, bao gồm bot giao dịch, chỉ báo và plugin, được cung cấp bởi các nhà phát triển bên thứ ba và chỉ nhằm mục đích cung cấp thông tin và tiếp cận kỹ thuật. cTrader Store không phải là nhà môi giới và không cung cấp lời khuyên đầu tư, khuyến nghị cá nhân hay bất kỳ đảm bảo nào về hiệu suất trong tương lai.


Giá
42.11M
Khối lượng đã giao dịch
6.13M
Pip đạt được
224
Lượt bán
8.42K
Cài đặt miễn phí