Precision FVG Analysis - Profesjonalny wskaźnik Fair Value Gap
Przegląd
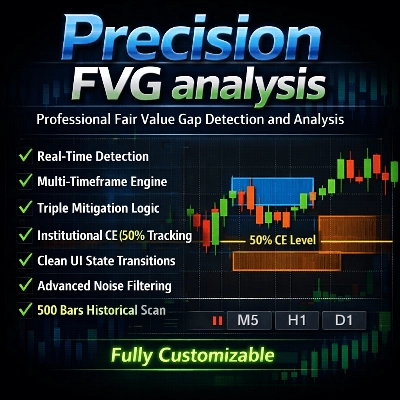
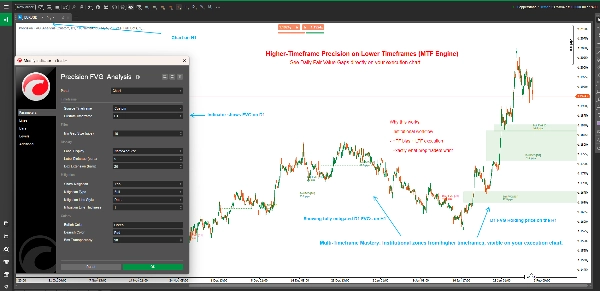
Precision FVG Analysis to potężny i elastyczny wskaźnik wykrywający Fair Value Gap (FVG), zaprojektowany dla poważnych traderów korzystających z koncepcji Smart Money Concepts (SMC) oraz metodologii ICT. Ten zaawansowany wskaźnik automatycznie identyfikuje, śledzi i wizualizuje Fair Value Gaps na wielu interwałach czasowych z zaawansowanymi możliwościami śledzenia mitigacji.
Fair Value Gaps reprezentują nierównowagi na rynku, gdzie cena poruszyła się zbyt szybko, pozostawiając niesprawności, które często są ponownie odwiedzane. Zrozumienie i handel tymi lukami jest kluczowy dla nowoczesnych traderów opierających się na analizie price action.
Kluczowe cechy
🎯 Analiza wielointerwałowa
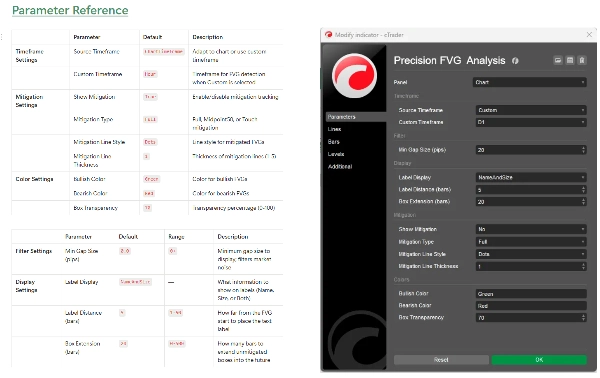
- Adaptacyjne wykrywanie interwału: Wybierz wyświetlanie FVG z aktualnego interwału wykresu lub dowolnego niestandardowego interwału
- Handel między interwałami: Wyświetlaj FVG z wyższych interwałów na wykresach niższych interwałów dla lepszego kontekstu handlu
- Inteligentne etykiety interwałów: Automatyczna identyfikacja interwału w etykietach przy użyciu niestandardowych interwałów
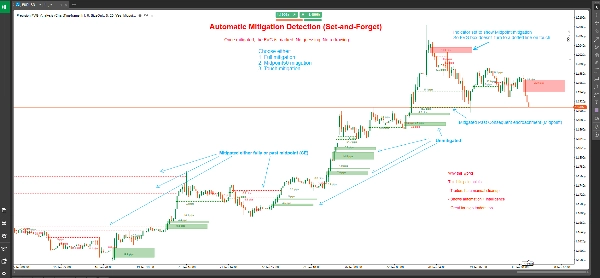
📊 Zaawansowane śledzenie mitigacji
- Trzy typy mitigacji:
-
- Pełna mitigacja: Cena całkowicie wypełnia całą lukę (najbardziej konserwatywne podejście)
- 50% punkt środkowy (CE): Cena osiąga poziom Consequent Encroachment (zrównoważone podejście)
- Mitigacja dotknięcia: Cena dotyka granicy luki (najbardziej czułe)
- Zmiany stanu wizualnego: Niezmitigowane FVG wyświetlane są jako wypełnione pola; zmitigowane FVG zmieniają się w linie przerywane
- Precyzyjne oznaczenie mitigacji: Pokazuje dokładną świecę, na której nastąpiła mitigacja
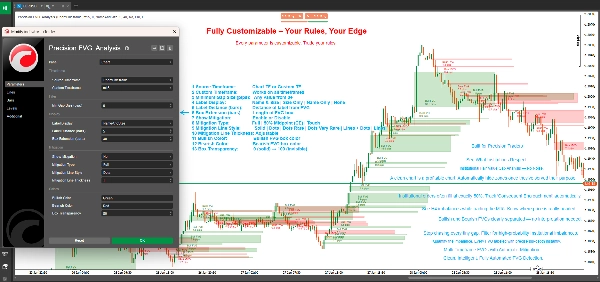
🎨 W pełni konfigurowalny wyświetlacz
- Elastyczne rozszerzenie pola: Kontroluj, jak daleko pola FVG rozciągają się w przyszłość (0-500 słupków)
- Inteligentny system etykietowania: Wybierz spośród czterech trybów etykiet:
-
- Nazwa i rozmiar: Pełne szczegóły z typem FVG i rozmiarem w pipsach
- Tylko rozmiar: Tylko rozmiar luki w pipsach
- Tylko nazwa: Identyfikacja typu FVG
- Brak: Czysty wykres bez etykiet
- Kolory niestandardowe: Oddzielne schematy kolorów dla byków i niedźwiedzi
- Regulowana przezroczystość: Przezroczystość pola od 0-100%
- Dostosowanie linii mitigacji: Wybierz styl i grubość linii dla zmitigowanych FVG
⚙️ Profesjonalne filtrowanie
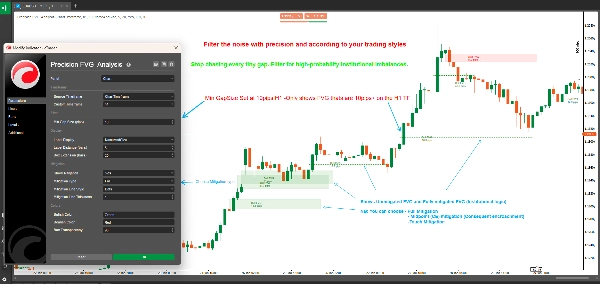
- Filtr minimalnego rozmiaru luki: Ustaw minimalny wymóg pipsów, aby odfiltrować nieistotne luki
- Automatyczne wykrywanie: Identyfikacja FVG w czasie rzeczywistym przy zamknięciu każdej świecy
- Skanowanie historyczne: Automatyczne skanowanie do 500 historycznych słupków podczas inicjalizacji
Czym są Fair Value Gaps?
Fair Value Gaps (FVG) występują, gdy istnieje niesprawność cenowa pomiędzy trzema kolejnymi świecami:
Byczy FVG: Tworzy się, gdy niska cena bieżącej świecy jest wyższa niż wysoka cena świecy sprzed dwóch słupków, a środkowa świeca zamyka się powyżej tej wysokiej ceny. Tworzy to lukę w górę, która często działa jako wsparcie.
Niedźwiedzi FVG: Tworzy się, gdy wysoka cena bieżącej świecy jest niższa niż niska cena świecy sprzed dwóch słupków, a środkowa świeca zamyka się poniżej tej niskiej ceny. Tworzy to lukę w dół, która często działa jako opór.
Te luki reprezentują obszary, gdzie miały miejsce agresywne zakupy lub sprzedaże, pozostawiając nierównowagi cenowe, które rynek często odwiedza ponownie w celu "sprawiedliwej wartości" przed kontynuacją w pierwotnym kierunku.
Zrozumienie typów mitigacji
Pełna mitigacja (konserwatywna)
- Byczy FVG: Mitigowany, gdy cena handluje poniżej dolnej granicy luki
- Niedźwiedzi FVG: Mitigowany, gdy cena handluje powyżej górnej granicy luki
- Przypadek użycia: Potwierdzenie, że luka została całkowicie wypełniona, odpowiednie dla traderów swingowych i strategii poszukujących potwierdzenia
50% punkt środkowy / CE (zrównoważony)
- Byczy FVG: Mitigowany, gdy cena osiąga lub przechodzi poniżej punktu środkowego
- Niedźwiedzi FVG: Mitigowany, gdy cena osiąga lub przechodzi powyżej punktu środkowego
- Przypadek użycia: Poziom Consequent Encroachment (CE) to często miejsce składania zleceń przez instytucje, co czyni go idealnym do wejść z dobrym stosunkiem ryzyka do zysku
Mitigacja dotknięcia (agresywna)
- Byczy FVG: Mitigowany, gdy cena dotyka lub przechodzi górną granicę
- Niedźwiedzi FVG: Mitigowany, gdy cena dotyka lub przechodzi dolną granicę
- Przypadek użycia: System wczesnego ostrzegania dla traderów chcących łapać reakcje na granicach FVG, idealny do skalpowania i szybkich wejść
Jak używać
Podstawowa konfiguracja
- Dodaj Precision FVG Analysis do swojego wykresu
- Ustaw preferowany Źródłowy interwał czasowy:
-
- Wybierz "ChartTimeframe", aby wykrywać FVG na aktualnym wykresie
- Wybierz "Custom" i wybierz konkretny interwał (np. H4, D1), aby zobaczyć FVG z wyższych interwałów
- Skonfiguruj Minimalny rozmiar luki, aby odfiltrować małe, nieistotne luki (zalecane: 2-5 pipsów dla forex)
Konfiguracja mitigacji
- Włącz Pokaż mitigację, aby aktywować śledzenie mitigacji
- Wybierz swój Typ mitigacji zgodnie ze stylem handlu:
-
- Traderzy dzienni i skalperzy: rozważ "Touch" lub "Midpoint50"
- Traderzy swingowi: używaj "Full" dla potwierdzenia
- Dostosuj wygląd linii mitigacji za pomocą Styl linii i Grubość
Dostosowanie wizualne
- Ustaw Rozszerzenie pola, aby kontrolować, jak daleko pola się projektują (domyślnie 20 słupków)
- Wybierz preferowany Wyświetlacz etykiet
- Dostosuj Kolor byczy i Kolor niedźwiedzi, aby dopasować do motywu wykresu
- Doprecyzuj Przezroczystość pola dla optymalnej widoczności
Strategie handlowe
Strategia 1: FVG z wyższego interwału z wejściem na niższym interwale
- Ustaw wskaźnik na interwał H4 lub D1 na wykresie M15 lub M5
- Zidentyfikuj niezmitigowane FVG z wyższego interwału
- Czekaj, aż cena zbliży się do FVG na niższym interwale
- Szukaj potwierdzenia na niższym interwale (formacje świecowe, bloki zleceń itp.)
- Wejdź, gdy cena osiągnie wybrany poziom mitigacji
Strategia 2: Strefy konfluencji FVG
- Użyj wielu instancji wskaźnika z różnymi interwałami
- Zidentyfikuj obszary, gdzie nakładają się FVG z różnych interwałów
- Te strefy konfluencji oferują lokalizacje o wysokim prawdopodobieństwie udanego handlu
- Użyj śledzenia mitigacji, aby precyzyjnie wyznaczyć moment wejścia
Strategia 3: Potwierdzenie wybicia
- Zidentyfikuj kluczowe poziomy wsparcia/oporu
- Obserwuj formowanie się FVG podczas wybicia
- Niezmitigowane FVG w kierunku wybicia sugerują kontynuację
- Zmitigowane FVG sugerują potencjalne nieudane wybicie lub odwrócenie
Strategia 4: Skalpowanie oparte na mitigacji
- Używaj mitigacji dotknięcia na niższych interwałach (M1, M5)
- Wchodź natychmiast, gdy FVG zostanie dotknięty
- Celuj w poprzedni lokalny szczyt/dno
- Używaj ciasnych stopów poniżej/powyżej FVG
Specyfikacje techniczne
- Platforma: cTrader
- Typ: Wskaźnik nakładkowy
- Obliczenia: W czasie rzeczywistym przy zamknięciu słupka
- Historyczne słupki: Skanuje do 500 słupków podczas inicjalizacji
- Maksymalna liczba aktywnych FVG: 500 jednoczesnych luk
- Zużycie zasobów: Lekki i zoptymalizowany pod kątem wydajności
Najlepsze praktyki
Ogólne wytyczne handlowe
- Łącz z innymi koncepcjami: FVG działają najlepiej w połączeniu z blokami zleceń, pulami płynności i strukturą rynku
- Szanuj kontekst rynku: FVG z wyższych interwałów mają większe znaczenie niż te z niższych
- Używaj wielu interwałów: Nakładaj FVG z różnych interwałów dla konfluencji
- Zarządzanie ryzykiem: Zawsze stosuj odpowiednie stop lossy; nie wszystkie FVG się utrzymają
Wskazówki optymalizacyjne
- Dostosuj minimalny rozmiar luki: Ustaw na podstawie średniej zmienności instrumentu
- Rozszerzenie pola: Dłuższe dla handlu swingowego (50-100 słupków), krótsze dla day tradingu (10-20 słupków)
- Typ mitigacji: Dopasuj do swojego interwału i stylu handlu
- Odległość etykiety: Dostosuj w zależności od zagracenia wykresu i poziomu zoomu
Typowe pułapki do unikania
- Nadmierny handel: Nie każda luka FVG jest okazją do handlu
- Ignorowanie kontekstu: FVG przeciwko silnym trendom są mniej wiarygodne
- Zły typ mitigacji: Skalperzy używający pełnej mitigacji tracą wejścia; traderzy swingowi używający dotknięcia są wybijani
- Brak potwierdzenia: Zawsze czekaj na potwierdzenie price action na poziomach FVG
Najczęściej zadawane pytania
P: Dlaczego niektóre FVG znikają natychmiast? O: Gdy "Pokaż mitigację" jest włączone z mitigacją "Touch", FVG, które są natychmiast cofnięte, szybko zmieniają się w linie przerywane. To normalne zachowanie.
P: Czy mogę zobaczyć FVG z wielu interwałów jednocześnie? O: Tak! Dodaj wskaźnik wielokrotnie do wykresu z różnymi niestandardowymi interwałami dla analizy wielointerwałowej.
P: Czym różni się ten wskaźnik od innych wskaźników FVG? O: Precision FVG Analysis oferuje możliwość pracy na wielu interwałach, trzy typy mitigacji oraz lepszą czytelność wizualną dzięki renderowaniu stanów (pola vs linie).
P: Który typ mitigacji powinienem używać? O: Zacznij od Midpoint50 (CE), ponieważ równoważy wczesne sygnały z niezawodnością. Dostosuj w zależności od wyników i stylu handlu.
P: Czy działa na wszystkich instrumentach? O: Tak, wskaźnik działa na Forex, indeksach, towarach i kryptowalutach. Dostosuj parametr "Minimalny rozmiar luki" w zależności od zmienności instrumentu.
P: Jak daleko sięga skanowanie historyczne? O: Wskaźnik skanuje do 500 słupków podczas inicjalizacji, zapewniając kompleksowy kontekst historyczny.
Wsparcie i aktualizacje
Ten wskaźnik jest aktywnie utrzymywany i aktualizowany. Użytkownicy otrzymują:
- Regularne aktualizacje z nowymi funkcjami
- Optymalizacje wydajności
- Poprawki błędów i ulepszenia
- Aktualizacje dokumentacji
W przypadku pytań, sugestii lub wsparcia prosimy o kontakt przez system wiadomości sklepu cTrader.
Zastrzeżenie
Handel wiąże się z dużym ryzykiem utraty kapitału i nie jest odpowiedni dla wszystkich inwestorów. Wyniki historyczne nie gwarantują przyszłych rezultatów. Ten wskaźnik jest narzędziem analitycznym i nie stanowi porady finansowej. Zawsze stosuj odpowiednie zarządzanie ryzykiem i nigdy nie ryzykuj więcej, niż możesz sobie pozwolić stracić.
Historia wersji
Wersja 1.0 (Aktualna)
- Wykrywanie FVG na wielu interwałach
- Trzy typy mitigacji (Pełna, Midpoint50, Touch)
- Zmiany stanu wizualnego (pola na linie przerywane)
- Niestandardowe kolory i przezroczystość
- Elastyczny system etykietowania
- Skanowanie historyczne (500 słupków)
- Wykrywanie i śledzenie w czasie rzeczywistym
Precision FVG Analysis - Podnieś swój handel Fair Value Gap na profesjonalny poziom.
5 | 100 % | |
4 | 0 % | |
3 | 0 % | |
2 | 0 % | |
1 | 0 % |


