

Opis
POMYSŁ
Średnia krocząca, która zaczyna się od wybranego punktu cenowego zamiast wymuszać każdą analizę w stałym okresie retrospektywnym.
PROBLEM
Tradycyjna średnia krocząca jest definiowana przez okres.
20 świec. 50 świec. 200 świec.
Ale czasem ważne pytanie nie brzmi ile świec chcesz zmierzyć.
Chodzi o to, od którego momentu pomiar powinien się zacząć.
Stały okres patrzy wstecz od bieżącej świecy, ale nie wie, które zdarzenie cenowe ma znaczenie dla twojej analizy.
Jeśli korekta zaczyna się tutaj, lub impuls zaczyna się tam, średnia krocząca o okresie 50 nie może zostać poinstruowana:
"Zacznij mierzyć od tego zdarzenia."
Okres definiuje okno pomiaru.
Nie definiuje jego początku.
GŁÓWNA KONCEPCJA: ANCHOR DEFINIUJE POCZĄTEK. ŚREDNIA KROCZĄCA MIERZY OD TEGO MOMENTU.
Draggable Moving Average zmienia punkt odniesienia.
Tradycyjne średnie kroczące czynią okres głównym punktem odniesienia.
Draggable Moving Average czyni początek głównym punktem odniesienia.
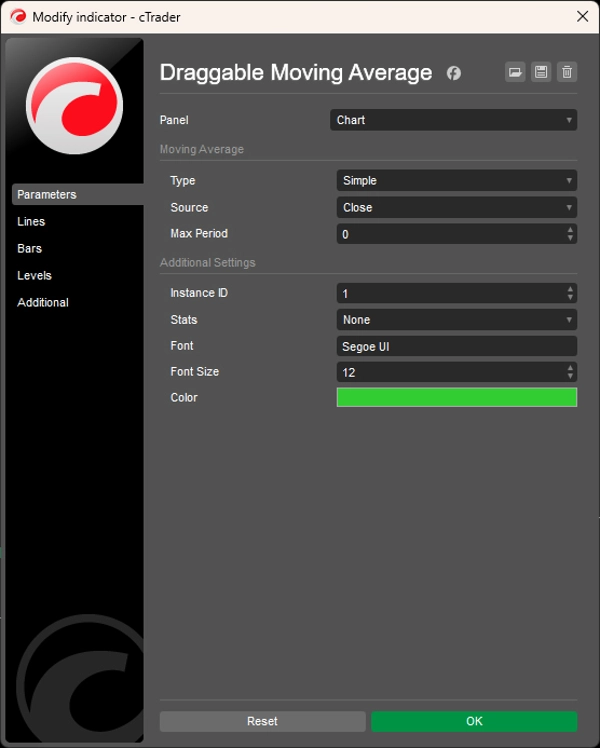
Okres nadal określa, jak zachowuje się obliczenie, podczas gdy parametr Max Period ogranicza okno obliczeń kroczących, gdy rozwija się ono do przodu od anchor.
Ale anchor określa gdzie zaczyna się pomiar.
To zmienia pytanie z:
"Który okres średniej kroczącej powinienem użyć?"
na:
"Które zdarzenie cenowe chcę, aby ta średnia krocząca mierzyła?"
CO TO ROBI
Draggable Moving Average pozwala samodzielnie zdefiniować ten początek.
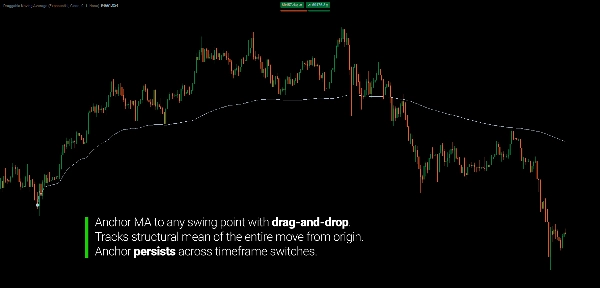
Umieść anchor na dowolnej świecy w historii cen, a średnia krocząca zacznie się liczyć od tego dokładnego punktu do przodu.
Przeciągnij anchor na inną świecę, a średnia krocząca przeliczy się natychmiast.
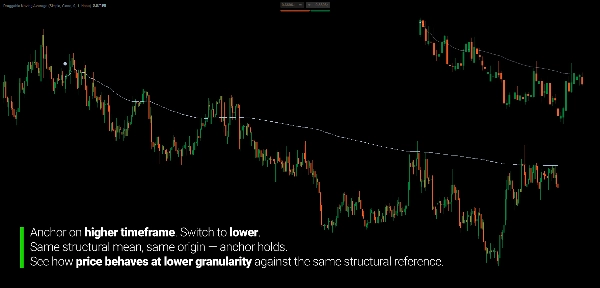
Zmień interwał czasowy, a anchor pozostanie przypięty do tego samego historycznego odniesienia, podczas gdy obliczenia dostosują się do danych dostępnych na nowym wykresie.
Odniesienie jest jawne — nie ukryte wewnątrz okresu.
JAK TO DZIAŁA
Proces jest celowo prosty:
1. Umieść anchor.
Wybierz dowolną świecę, która ma znaczenie dla twojej analizy.
2. Średnia krocząca zaczyna się tam.
Obliczenia zaczynają się od wybranego przez ciebie początku i rozwijają się do przodu.
3. Pozwól cenie się rozwijać.
W miarę pojawiania się nowych świec, średnia uwzględnia ewoluujące dane cenowe.
4. Przesuń anchor, gdy zmieni się twoje odniesienie.
Przeciągnij anchor na inną świecę, a całe obliczenie zostanie natychmiast zaktualizowane.
Nie ma potrzeby ciągłego zmieniania okresu średniej kroczącej, aby przybliżyć inny punkt startowy.
Zmień samo odniesienie.
ŚREDNIA KROCZĄCA ZBUDOWANA WOKÓŁ RUCHU
Gdy średnia krocząca jest zakotwiczona na początku konkretnego ruchu cenowego, obliczenia rozwijają się od tego początku do przodu.
Daje to średniej kroczącej inny kontekst niż konwencjonalna średnia krocząca.
Ruch korekcyjny może mieć swoją własną zakotwiczoną średnią kroczącą.
Impuls może mieć inną.
Główna zmiana kierunku może mieć kolejną.
Nie pytasz już średniej kroczącej o opisanie dowolnej liczby ostatnich świec.
Pytasz ją o zmierzenie konkretnej części rynku.
OBSERWUJ, JAK CENA ROZWIJA SIĘ WOKÓŁ ŚREDNIEJ
Zakotwiczona średnia krocząca może służyć jako odniesienie do obserwacji, jak cena zachowuje się podczas ruchu.
Cena może:
- Oddalić się od średniej podczas silnego ruchu
- Powrócić w kierunku średniej podczas konsolidacji lub korekty
- Przeciąć średnią, gdy zmienia się charakter ruchu
- Ponownie odwiedzić średnią po zmianie kierunku
Te zachowania nie są traktowane jako automatyczne sygnały handlowe.
Cel jest prostszy:
uczynić widoczną średnią zdefiniowanego ruchu cenowego.
Znaczenie pochodzi z ruchu, który wybrałeś do zmierzenia — a nie z konkretnej wartości średniej kroczącej.
PIĘĆ SPOSOBÓW OBLICZANIA ŚREDNIEJ
Wybierz obliczenie najlepiej pasujące do twojej analizy:
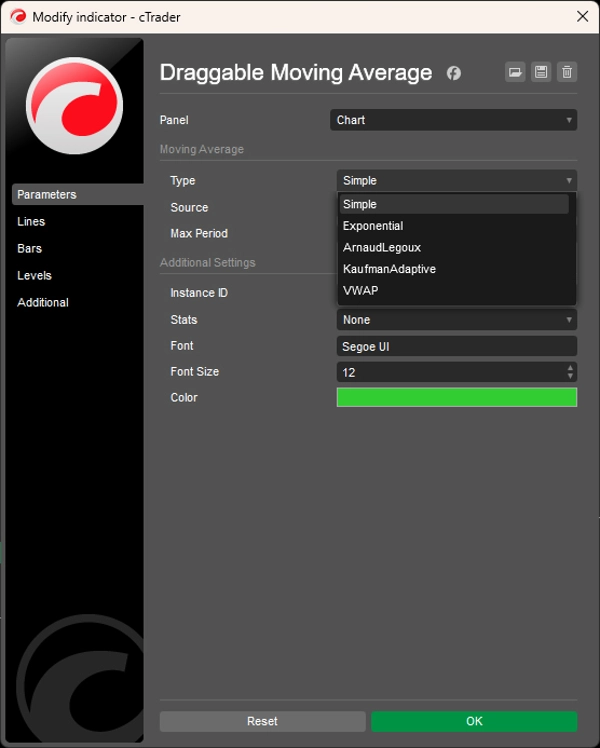
Prosta (SMA)
Prosta średnia arytmetyczna rozwijająca się od anchor.
Wykładnicza (EMA)
Nadaje większą wagę nowszym danym cenowym.
Arnaud Legoux (ALMA)
Średnia ważona zaprojektowana tak, aby zmniejszyć opóźnienie przy zachowaniu płynności.
Kaufman Adaptive (KAMA)
Dostosowuje wygładzanie w zależności od efektywności rynku.
VWAP
Mierzy średnią cenę ważoną wolumenem od wybranego początku.
Wszystkie typy obliczeń zachowują tę samą podstawową ideę:
anchor definiuje, gdzie zaczyna się pomiar.
ODNIESIENIE PRZETRWUJE ZMIANĘ INTERWAŁU CZASOWEGO
Jedną z najbardziej użytecznych cech zdefiniowanego anchor jest to, że odniesienie nie znika po zmianie interwału czasowego.
Zakotwicz początek ruchu na wykresie dziennym.
Przełącz na H1.
Następnie na M15.
Anchor pozostaje przypięty do tego samego punktu historycznego, podczas gdy średnia krocząca przelicza się, wykorzystując dane dostępne na nowym interwale.
To czyni go użytecznym do analizy wielointerwałowej, gdzie to samo zdarzenie cenowe musi pozostać odniesieniem na różnych rozdzielczościach wykresu.
OPCJONALNE STATYSTYKI
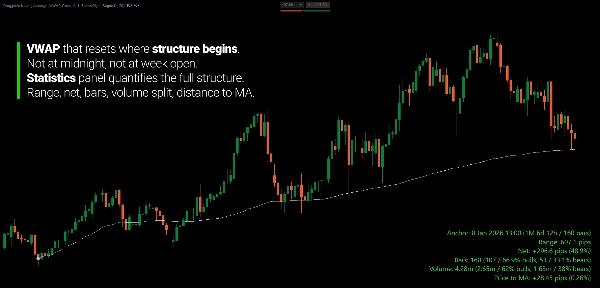
Opcjonalny panel statystyk zapewnia ilościowy widok ruchu cenowego między anchor a bieżącą świecą.
Może wyświetlać:
- Zasięg w pipsach
- Zmianę netto w pipsach i procentach
- Liczbę i procent świec byczych / niedźwiedzich
- Wolumen byczy / niedźwiedzi i procenty
- Odległość ceny od średniej kroczącej w pipsach i procentach
- Czas trwania
- Liczbę świec od anchor
Panel jest opcjonalny.
Głównym narzędziem pozostaje zakotwiczona średnia krocząca.
WIELE ODNIESIEŃ
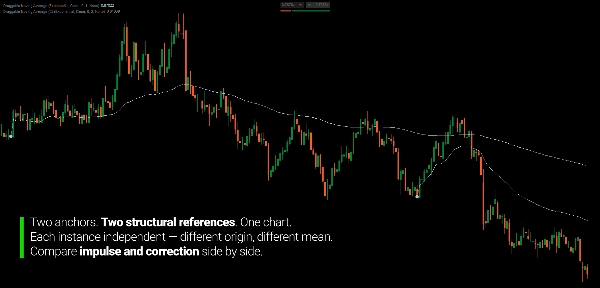
Można używać wielu instancji jednocześnie.
Jedna średnia krocząca może być zakotwiczona na początku korekty.
Inna może być zakotwiczona na poprzednim impulsie.
Każda instancja ma swoją tożsamość, pozwalając na niezależne mierzenie różnych ruchów cenowych na tym samym wykresie.
ZAPROJEKTOWANE DO POMIARU, NIE DO ŚCIGANIA SYGNAŁÓW
Draggable Moving Average nie mówi ci, gdzie kupować lub sprzedawać.
Daje ci coś bardziej fundamentalnego:
sposób na dokładne określenie, którą część rynku chcesz, aby średnia krocząca mierzyła.
Użyj go do badania:
- Ruchów impulsowych i korekcyjnych
- Rozwoju wahnięć
- Zachowania ceny wokół zdefiniowanej średniej
- Powrotu do średniej w ramach konkretnego ruchu
- Zmian charakteru ruchu
- Odniesień z wyższych interwałów czasowych z wykresów o niższych interwałach
- Różnych rozkładów cen z różnych punktów początkowych
Indykator nie decyduje, który punkt ma znaczenie.
Ty wybierasz odniesienie. Średnia krocząca mierzy, co się dzieje od tego momentu.
KLUCZOWE CECHY
- W pełni przeciągalny anchor
- Punkt startowy definiowany przez użytkownika
- Średnia krocząca przelicza się natychmiast po przesunięciu anchor
- Anchor utrzymuje się podczas zmiany interwału czasowego
- Pięć metod średnich kroczących: SMA, EMA, ALMA, KAMA, VWAP
- Osiem wybieralnych źródeł cen
- Limit Max Period z oknem kroczącym od punktu początkowego anchor
- Opcjonalny panel statystyk z czterema pozycjami narożnymi
- Wiele niezależnych instancji
- Zaprojektowany do analizy wielointerwałowej
---
Trading wiąże się z ryzykiem. Ten wskaźnik jest narzędziem analizy technicznej i powinien być używany razem z odpowiednim zarządzaniem ryzykiem.
Podsumowanie
This approach transforms the MA into a structural mean that reflects the average price evolution from a defined origin, aiding in mean reversion and reversal detection. Price behavior around this anchored MA provides insights into momentum, consolidation, and potential trend exhaustion.
The indicator supports five MA calculation methods—Simple (SMA), Exponential (EMA), Arnaud Legoux (ALMA), Kaufman Adaptive (KAMA), and Volume Weighted Average Price (VWAP)—with a configurable maximum period to cap the lookback window. It offers eight price source options and an optional statistics panel displaying real-time metrics such as range, net change, volume splits, and price distance from the MA.
Multiple instances can run simultaneously, each with a unique ID, allowing concurrent analysis of different structural moves without conflicts. This tool is designed for swing and position traders, multi-timeframe analysts, and discretionary traders who require precise, structure-based MA anchoring rather than arbitrary period-based averages.
Opinie klientów
Dyskusja
Częste pytania





















Cena
