


Penerangan
IDEA
Profil Isipadu yang menyesuaikan dengan pergerakan harga tepat yang ditentukan oleh julat yang dipilih dan bukannya memaksa analisis ke dalam tempoh yang telah ditetapkan.
MASALAH
Kebanyakan alat Profil Isipadu dibina berdasarkan tempoh yang telah ditetapkan.
Sesi. Hari. Minggu. Kaji semula tetap.
Tetapi pergerakan harga yang anda ingin kaji jarang sesuai dengan sempadan tersebut.
Satu kaki tren boleh bermula di tengah sesi.
Pembetulan boleh merangkumi beberapa tempoh.
Pergerakan ayunan-ke-ayunan boleh bermula dan berakhir di mana-mana pada carta.
Masalahnya bukan semestinya Profil Isipadu itu sendiri.
Masalahnya adalah membiarkan tempoh masa menentukan pergerakan harga mana yang dianalisis.
KONSEP TERAS: TENTUKAN JULAT. BIARKAN PROFIL MENYESUAIKAN DIRINYA.
Profil Isipadu Julat Tersuai membalikkan hubungan itu.
Daripada bertanya:
"Tempoh mana yang harus profil analisis?"
anda menentukan:
"Pergerakan harga mana yang saya mahu analisis?"
Dua sauh menentukan julat.
Penunjuk mengukur harga tertinggi dan terendah antara dua sauh itu, kemudian membina profil isipadu di dalam julat harga itu.
Ini menjadikan pergerakan harga sebagai rujukan utama dan bukannya tempoh yang telah ditetapkan.
Anda menentukan julat. Profil menyesuaikan diri dengannya.
APA YANG DILAKUKANNYA
Letakkan dua sauh pada bar yang anda ingin kaji.
Penunjuk secara automatik membina Profil Isipadu untuk julat itu menggunakan jangka masa sumber yang dipilih.
Gerakkan mana-mana sauh, dan profil dikira semula dengan segera.
Oleh itu, anda boleh menentukan dan menentukan semula pergerakan terus dari carta tanpa terhad oleh sempadan sesi, kaji semula tetap, atau tempoh yang telah ditetapkan lain.
Gunakannya untuk mengkaji:
- Satu kaki tren keseluruhan
- Pembetulan atau pengukuhan
- Pergerakan antara dua titik ayunan
- Impuls tertentu dan pembetulannya
- Mana-mana pergerakan harga lain yang penting untuk analisis anda
Profil kemudian menunjukkan di mana isipadu terkumpul di dalam pergerakan khusus itu.
JANGKA MASA SUMBER AUTOMATIK
Julat yang dipilih dan jangka masa yang digunakan untuk mengira profilnya tidak perlu sama.
Apabila Mod Auto diaktifkan, penunjuk mencari melalui senarai jangka masa yang anda konfigurasikan dan memilih jangka masa terperinci yang mampu merangkumi julat yang dipilih sambil kekal dalam had pemprosesan 5,000 bar.
Ini membolehkan julat sejarah yang besar dianalisis menggunakan jangka masa sumber yang lebih terperinci daripada carta yang anda lihat, jika ada.
Sebagai contoh:
Carta H4 → julat terpilih berbilang hari → jangka masa sumber yang lebih terperinci seperti M1, M5, atau M15
Anda juga boleh mematikan mod Auto dan menggunakan jangka masa carta secara langsung.
TIGA CARA UNTUK MEMBACA PROFIL
Pilih bagaimana anda ingin memeriksa taburan isipadu:
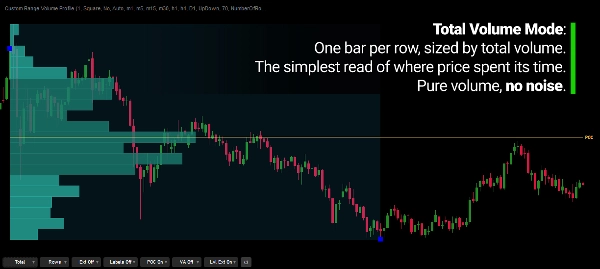
Jumlah
Menunjukkan jumlah isipadu pada setiap baris harga, memudahkan melihat di mana aktiviti tertumpu.
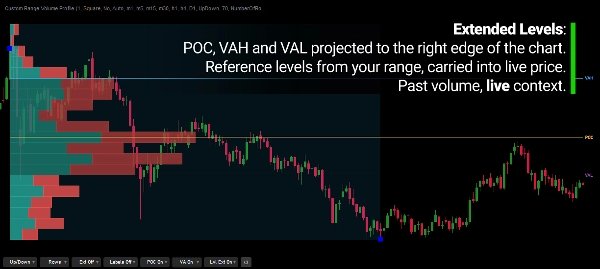
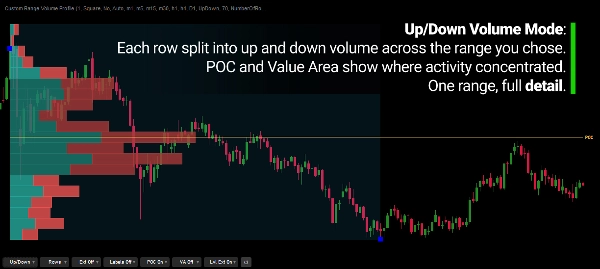
Naik / Turun
Memisahkan isipadu mengikut sama ada bar sumber ditutup di atas atau di bawah pembukaannya.
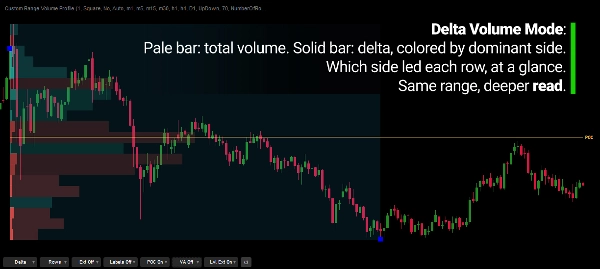
Delta
Memaparkan jumlah isipadu bersama perbezaan antara isipadu naik dan turun.
Mod paparan boleh diubah terus dari kawalan pada carta tanpa membuka semula tetapan penunjuk.
TAHAP UTAMA
Profil boleh memaparkan:
- Titik Kawalan (POC) — baris harga dengan isipadu tertinggi
- Nilai Kawasan Tinggi (VAH)
- Nilai Kawasan Rendah (VAL)
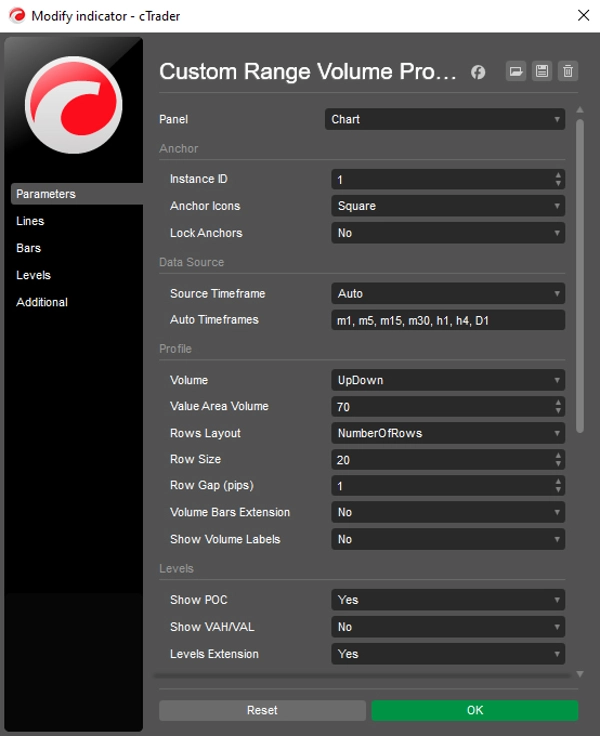
- Peratusan Nilai Kawasan yang boleh dikonfigurasikan, lalai 70%
- Sambungan tahap pilihan
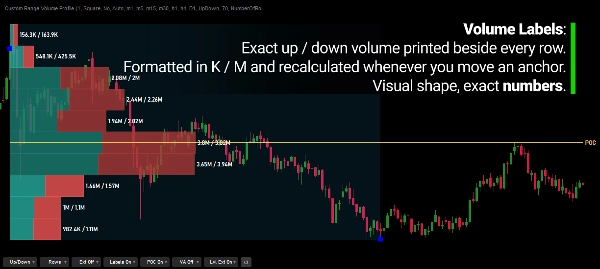
- Label isipadu
Tahap ini menyediakan rujukan tambahan untuk memahami di mana aktiviti tertumpu dalam pergerakan yang dipilih.
JULAT TERUS DI BAWAH KAWALAN ANDA
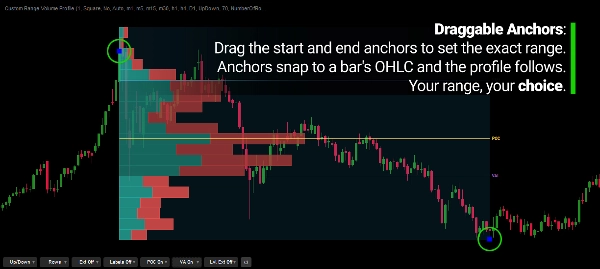
Sauh boleh digerakkan terus pada carta, dikunci untuk mengelakkan pergerakan tidak sengaja, dan boleh melekat pada:
- Pembukaan
- Tinggi
- Rendah
- Penutupan
Ini memberi anda kawalan tepat terhadap apa yang termasuk dalam profil.
Tukar titik permulaan.
Tukar titik penamatan.
Tukar pergerakan yang anda kaji.
Profil mengikuti julat.
BERBILANG PROFIL. BERBILANG RUJUKAN.
Berbilang profil bebas boleh dipaparkan pada carta yang sama.
Setiap profil boleh mempunyai julat dan tetapan sendiri, membolehkan pergerakan harga yang berbeza dianalisis serentak.
Sebagai contoh, satu profil boleh mewakili impuls manakala satu lagi merangkumi pembetulannya.
Julat kekal bebas.
RESOLUSI PROFIL FLEKSIBEL
Pilih bagaimana profil membahagikan harga:
Baris Sasaran
Tentukan anggaran bilangan baris harga, dengan saiz tik setiap baris dipilih secara automatik untuk mendekati sasaran itu.
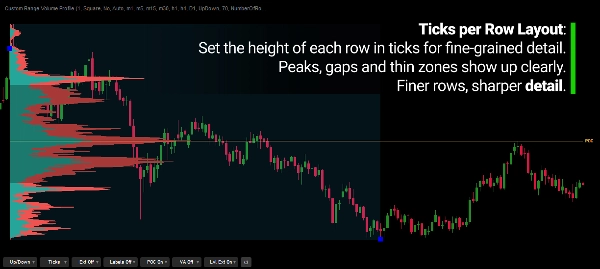
Tik Per Baris
Tentukan resolusi harga secara langsung melalui bilangan tik yang diperuntukkan untuk setiap baris.
Ini membolehkan profil dilihat pada tahap ketelitian yang berbeza bergantung pada pergerakan yang dikaji.
KAWALAN PADA CARTA
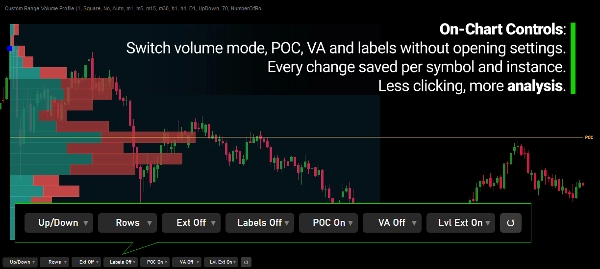
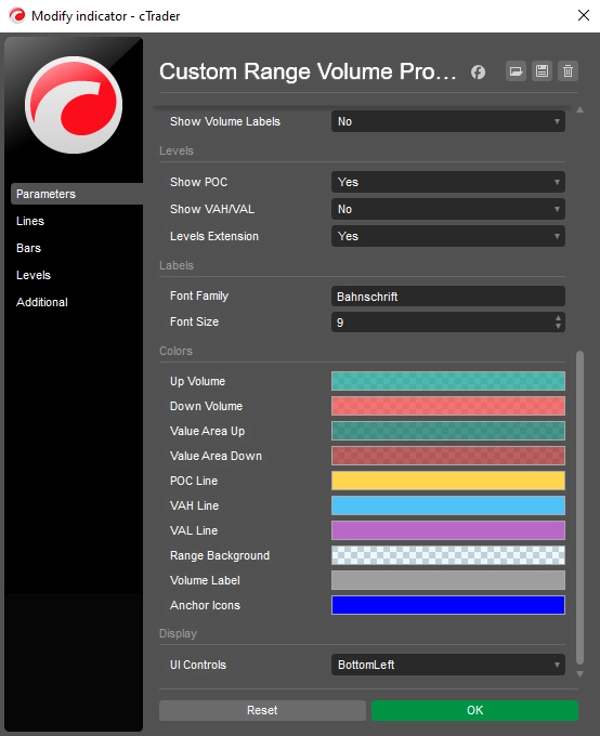
Tetapan yang kerap digunakan boleh disesuaikan terus dari carta.
Tukar:
- Mod isipadu
- Susun atur baris
- Sambungan
- Label
- Kebolehlihatan POC
- Kebolehlihatan Nilai Kawasan
tanpa membuka semula tetapan penunjuk berulang kali. Bar kawalan boleh diletakkan di mana-mana sudut atau disembunyikan, dan perubahan disimpan mengikut simbol dan setiap contoh.
PAPARAN YANG BOLEH DISESUAIKAN
Persembahan visual boleh disesuaikan untuk memenuhi aliran kerja anda.
Sesuaikan elemen seperti:
- Warna
- Fon
- Label
- Sambungan
- Parameter paparan lain
Pengiraan asas kekal bebas daripada persembahan visual.
MEMBACA PROFIL
Profil Isipadu menerangkan di mana aktiviti terkumpul merentasi harga sepanjang julat yang dipilih.
Kawasan isipadu tinggi menunjukkan harga di mana lebih banyak aktiviti berlaku, manakala kawasan nipis menunjukkan harga dengan isipadu terkumpul yang kurang.
Bentuk profil boleh memberikan konteks berguna:
- Isipadu tertumpu → aktiviti terkumpul di sekitar kawasan harga itu
- Kawasan nipis antara nod yang lebih berat → aktiviti terkumpul yang relatif kurang merentasi harga tersebut
- POC berhampiran satu tepi julat → aktiviti tertumpu ke satu sisi pergerakan yang dipilih
Ini adalah pemerhatian tentang apa yang telah berlaku.
Ia bukan ramalan tentang apa yang harga mesti lakukan seterusnya.
DATA & PENGIRAAN
Penunjuk ini menggunakan isipadu tik yang disediakan oleh suapan data broker anda.
Isipadu dari setiap bar sumber diagihkan merentasi julat harga bar itu.
Naik/Turun dan Delta mengklasifikasikan bar sumber mengikut pembukaan dan penutupnya.
Oleh itu, Delta mewakili isipadu bar berarah, bukan aliran pesanan bida/tanya sebenar pertukaran.
Hasilnya adalah anggaran taburan isipadu yang konsisten dan boleh dihasilkan semula untuk julat yang anda pilih.
DIBINA UNTUK ANALISIS JULAT HARGA
Profil Isipadu Julat Tersuai direka untuk mengkaji taburan isipadu di dalam pergerakan harga yang ditentukan, bukannya secara automatik memprofilkan tempoh masa sewenang-wenangnya.
Gunakannya untuk memeriksa:
- Taburan isipadu dalam tren
- Impuls dan pembetulan
- Pergerakan ayunan-ke-ayunan
- Kawasan isipadu tinggi dan rendah
- POC dan Nilai Kawasan
- Penerimaan harga dan kawasan aktiviti yang lebih nipis
- Taburan isipadu berbeza merentasi pergerakan harga yang berbeza
- Berbilang julat bebas pada carta yang sama
Penunjuk tidak menentukan pergerakan mana yang penting.
Anda menentukan julat. Ia membina profil.
CIRI UTAMA
- Dua sauh julat boleh seret dengan pilihan penguncian
- Sauh melekat pada Pembukaan, Tinggi, Rendah, atau Penutupan
- Profil julat harga tersuai
- Pemilihan jangka masa sumber automatik dari senarai jangka masa yang boleh dikonfigurasikan
- Pilihan jangka masa sumber manual
- Mod Jumlah / Naik-Turun / Delta
- Titik Kawalan
- Nilai Kawasan Tinggi / Rendah
- Peratusan Nilai Kawasan yang boleh dikonfigurasikan
- Baris Sasaran atau Tik Per Baris
- Berbilang profil bebas
- Kawalan pada carta
- Label isipadu pilihan dan sambungan POC / Nilai Kawasan
- Paparan visual yang boleh disesuaikan
- Pengiraan berdasarkan isipadu tik
---
Perdagangan melibatkan risiko. Penunjuk ini adalah alat analisis teknikal dan harus digunakan bersama dengan pengurusan risiko yang sesuai.
Ringkasan
Key features include three volume modes—Total, Up/Down, and Delta—that show different perspectives of volume activity. The indicator identifies the Point of Control (POC), the price level with the highest volume, and the Value Area, which covers a configurable percentage of total volume, with optional display of Value Area High (VAH) and Value Area Low (VAL) levels. Users can customize row layout, volume bar extensions, labels, colors, and on-chart controls for mode switching and display options.
Designed for swing, intraday, structure-based, and discretionary traders, this tool provides a contextual framework to understand where volume concentrated during specific moves, aiding in identifying key support and resistance levels based on volume distribution. Multiple independent profiles can be used simultaneously on the same chart.
Ulasan pelanggan
5 | 100 % | |
4 | 0 % | |
3 | 0 % | |
2 | 0 % | |
1 | 0 % |
Perbincangan
Soalan Lazim










![Logo "Gaussian Channel [Iridio Capital]"](https://cdn.ctrader.com/image/webp/2c4f9ca9-4e9b-476d-b5a6-787c8095032b_61546)












Harga