
APA YANG DILAKUKANNYA
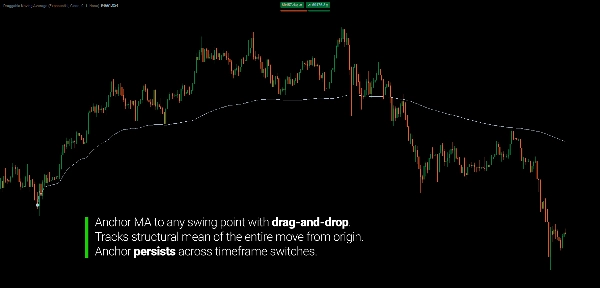
Draggable Moving Average menambatkan moving average ke titik mana pun dalam sejarah harga — bukan dari bar nol, bukan dari periode tetap, tetapi dari tepat di tempat Anda menempatkannya.
Moving average standar dimulai dari awal data grafik dan menyatu seiring waktu. Periode mereka tetap. Referensi awal mereka sembarangan. Ketika Anda ingin mengukur bagaimana harga telah berkembang sejak suatu peristiwa struktural tertentu — awal korektif, awal impuls, ayunan kunci — tidak ada cara untuk menambatkan MA ke momen itu.
Indikator ini menyelesaikan masalah itu.
Tempatkan ikon jangkar pada bar mana pun. MA dimulai dari bar itu dan meluas ke depan. Seret ikon ke bar yang berbeda — MA langsung menghitung ulang dari posisi baru. Ganti kerangka waktu — jangkar tetap, MA menghitung ulang secara otomatis pada grafik baru.
Hasilnya adalah moving average yang selalu mencerminkan bagaimana harga telah berkembang dari titik struktural spesifik yang Anda tentukan.
MANFAAT UTAMA
Pendekatan Standar:
- Identifikasi awal pergerakan korektif atau impuls
- Terapkan MA periode tetap — dimulai dari awal grafik, bukan dari struktur Anda
- Sesuaikan periode secara manual untuk mendekati panjang struktur
- Ganti kerangka waktu — periode menjadi tidak berarti dalam jumlah bar yang berbeda
- Ulangi setiap kali struktur berubah
Pendekatan Draggable:
- Tempatkan jangkar di awal struktur
- MA menghitung ke depan dari bar yang tepat itu
- Ganti kerangka waktu — jangkar tetap, MA menghitung ulang otomatis
- Seret untuk menyesuaikan — semuanya diperbarui secara instan
Perbedaannya bersifat struktural. Alih-alih mendekati titik referensi melalui penyesuaian periode, Anda mendefinisikannya secara langsung. Titik struktural adalah input — bukan periode.
DITAMBAHKAN PADA STRUKTUR: DETEKSI MEAN REVERSION DAN REVERSAL
Ketika moving average dimulai dari titik ayunan struktural — asal tren, awal impuls, atau awal koreksi — itu berhenti menjadi garis perataan sembarangan dan mulai berperilaku sebagai mean struktural.
Harga mengorganisasi di sekitar mean itu dengan cara yang dapat diprediksi:
- Selama pergerakan, harga berosilasi di sekitar MA yang ditambatkan — menjauh saat ledakan momentum, kembali ke MA saat konsolidasi. MA mencerminkan harga rata-rata seluruh struktur dari asalnya, bukan hanya bar terbaru.
- Saat kelelahan, harga mulai menembus MA yang ditambatkan daripada memantul darinya. Penutupan di bawah MA yang miring ke atas — yang telah mengikuti impuls dari asalnya — membawa makna struktural. Mean dari seluruh pergerakan sedang dilanggar.
- Setelah pembalikan, MA yang ditambatkan menjadi resistensi. Retest MA dari bawah menandai area logis di mana mean struktural sebelumnya bertindak sebagai suplai.
Perilaku ini konsisten karena MA mengukur hal yang tepat: harga rata-rata dari pergerakan struktural spesifik dari titik awalnya, bukan dari periode sembarangan yang lalu.
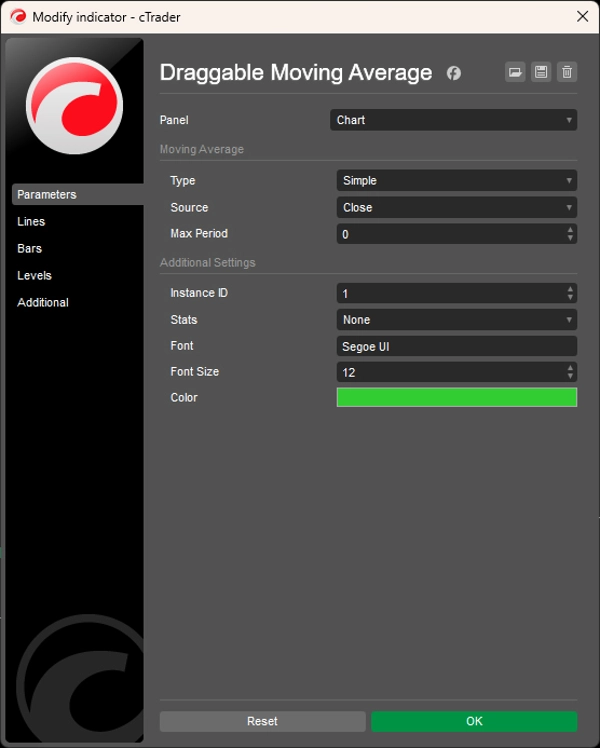
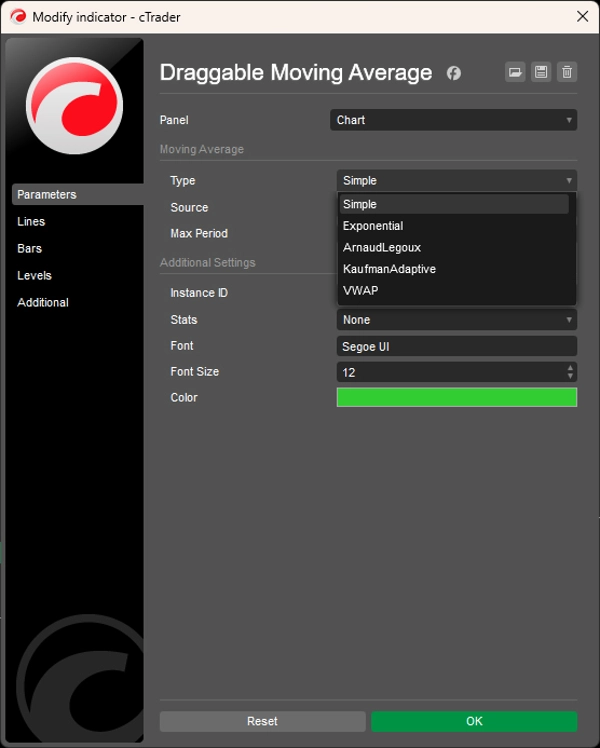
JENIS MA YANG DIDUKUNG
Lima metode perhitungan, dapat dipilih per instance:
- Simple (SMA) — rata-rata aritmatika dari jangkar ke depan; tumbuh dengan setiap bar sampai Max Period tercapai
- Exponential (EMA) — berbobot eksponensial; lebih responsif terhadap aksi harga terbaru
- Arnaud Legoux (ALMA) — berbobot Gaussian; mengurangi lag tanpa memperbesar noise
- Kaufman Adaptive (KAMA) — menyesuaikan smoothing secara dinamis berdasarkan rasio efisiensi pasar; mengencang saat kondisi tren, melebar saat konsolidasi
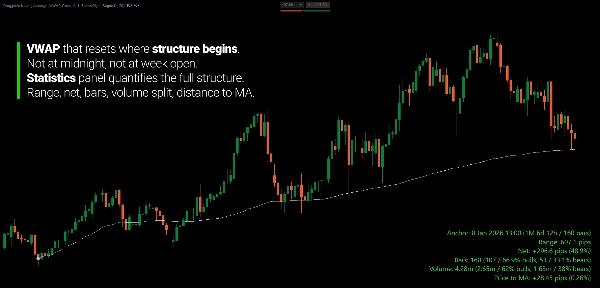
- VWAP — rata-rata berbobot volume dari jangkar; mencerminkan di mana sebagian besar volume telah diperdagangkan sejak titik struktural
Semua jenis menghormati Max Period — membatasi jendela lookback sambil menjaga jangkar sebagai referensi asal.
PANEL STATISTIK
Panel overlay opsional, dapat dipilih di empat posisi sudut, menampilkan metrik waktu nyata dari jangkar ke bar saat ini:
- Rentang dalam pips (tertinggi ke terendah)
- Perubahan bersih dalam pips dan persentase
- Total bar dengan hitungan bullish/bearish dan persentase
- Total volume dengan pembagian bullish/bearish dan persentase
- Jarak harga saat ini dari MA dalam pips dan persentase
- Durasi dan penghitung bar dari bar jangkar ke bar saat ini
Berguna untuk mengkuantifikasi struktur tepat yang Anda tambatkan — bukan hanya garis MA, tetapi profil statistik lengkap dari pergerakan harga dari asal hingga sekarang.
DUKUNGAN MULTI-INSTANCE
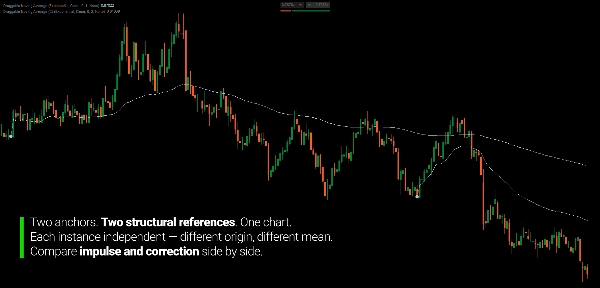
Setiap instance membawa ID Instance unik. Beberapa instance dapat berjalan bersamaan — satu ditambatkan ke awal koreksi, yang lain ke impuls sebelumnya — tanpa konflik ikon atau label.
FITUR UTAMA
- Ikon jangkar yang dapat diseret — tempatkan di bar mana pun, seret untuk menyesuaikan, MA diperbarui secara instan
- Lima jenis MA (SMA, EMA, ALMA, KAMA, VWAP)
- Delapan sumber harga (Open, High, Low, Close, Average, Median, Typical, Weighted)
- Batas Max Period dengan jendela bergulir dari asal jangkar
- Panel statistik opsional dengan empat posisi sudut
- Dukungan multi-instance dengan ID Instance unik
- Jangkar yang bertahan saat pergantian kerangka waktu
UNTUK SIAPA INI
Indikator ini untuk trader yang menganalisis struktur pasar di berbagai kerangka waktu — khususnya mereka yang ingin mengukur perilaku harga dari titik referensi struktural yang ditentukan daripada periode lookback sembarangan.
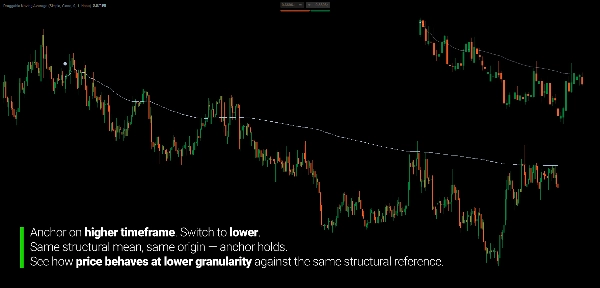
Jika Anda menganalisis kaki korektif dan impuls di kerangka waktu lebih tinggi dan perlu mengevaluasi struktur yang sama pada granularitas kerangka waktu lebih rendah, jangkar yang dapat diseret memungkinkan Anda menandai titik awal struktural sekali dan membawanya ke berbagai tampilan kerangka waktu. Jangkar di grafik Harian, ganti ke M15 — referensi tetap.
Ini cocok untuk trader swing dan posisi yang berpikir dalam pergerakan struktural daripada periode tetap, analis multi-kerangka waktu yang membutuhkan titik referensi konsisten di berbagai grafik, dan trader diskresioner yang menginginkan penambatan MA yang presisi dan ditentukan pengguna tanpa menebak periode.
Ini bukan sistem sinyal. Ini adalah alat pengukuran struktural untuk trader yang sudah berpikir dalam istilah pergerakan harga dan ingin moving average mereka mencerminkan pergerakan tersebut secara tepat.
APA YANG MEMBUATNYA BERBEDA
Moving average standar berbasis periode. Referensinya implisit — n bar ke belakang dari bar saat ini. Ketika pergerakan struktural berakhir dan yang baru dimulai, periode menjadi tidak relevan. Anda tidak dapat menunjuk MA standar ke peristiwa tertentu.
Indikator ini membuat referensi menjadi eksplisit. Anda menambatkan ke peristiwa struktural. MA mengukur dari sana. Periode bukan input — titik strukturallah yang menjadi input.
Hasilnya: moving average yang mencerminkan analisis struktural Anda yang sebenarnya daripada perkiraannya.
---
MEMAHAMI MOVING AVERAGE SEBAGAI MEAN STRUKTURAL
Moving average sering disalahpahami sebagai level support dan resistance. Trader menunggu harga "menghormati" MA 50 atau memantul dari MA 200 seolah angka-angka itu membawa makna pasar yang melekat. Padahal tidak.
Moving average adalah deskripsi aritmatika dari distribusi — harga rata-rata selama jendela yang ditentukan. Yang menentukan apakah garis itu bermakna bukanlah rumusnya. Melainkan apakah jendela yang diukur memiliki relevansi struktural.
Inilah sebabnya MA berbasis periode secara fundamental terbatas. MA 50 periode mengukur 50 bar terakhir — jendela tanpa hubungan dengan peristiwa struktural apa pun. Ini tidak sesuai dengan tempat tren dimulai atau koreksi dimulai. Ini adalah jendela bergulir dengan panjang sembarangan yang posisinya ditentukan hanya oleh kedekatan waktu.
Ketika Anda menambatkan ke titik ayunan struktural, MA menjadi mean dari distribusi harga spesifik dan koheren dari asal itu ke depan. Ketika harga menyimpang jauh di atasnya, partisipan yang masuk di asal diperpanjang. Ketika harga kembali ke sana, itu mencerminkan penyeimbangan ulang distribusi. Ketika harga menembusnya dengan bersih, partisipan rata-rata dari asal struktural berada pada titik impas atau rugi — perubahan rezim statistik, bukan garis yang dilanggar.
Geometri bukan penyebabnya. Ini adalah deskripsi statistik dari distribusi struktural yang batasnya telah Anda tentukan.
---
Trading melibatkan risiko. Indikator ini adalah alat analisis teknikal—selalu terapkan manajemen risiko yang tepat.


