
Penerangan
APA YANG DILAKUKANNYA
Saluran Fibonacci menyelesaikan masalah yang diabaikan oleh kebanyakan alat Fibonacci: di mana anda meletakkan sauh lebih penting daripada tahap yang anda lukis.
Kebanyakan pedagang menggunakan retracement Fibonacci secara manual — memilih ayunan tinggi dan ayunan rendah, melukis alat tersebut, dan berharap struktur itu bertahan. Hasilnya adalah snapshot statik yang menjadi tidak relevan sebaik sahaja harga melepasi mana-mana ekstrem.
Penunjuk ini mengubah pendekatan.
Daripada mengunci pada ayunan tetap, Saluran Fibonacci berlabuh pada titik pilihan anda dan sentiasa mengesan tinggi tertinggi dan rendah terendah dari sauh itu ke bar semasa. Apabila julat berkembang, saluran juga berkembang. Tahap Fibonacci sentiasa mencerminkan julat sebenar yang telah berkembang — bukan tekaan sejarah.
Saluran berkembang bersama pasaran. Tahap kekal bermakna.
Arah dikesan secara automatik. Dalam konteks bullish, tahap diukur dari atas ke bawah. Dalam konteks bearish, ia diukur dari bawah ke atas. Tiada pelarasan manual diperlukan — penunjuk membaca struktur dan mengorientasikan dengan sewajarnya.
MENGAPA FIBONACCI BERASASKAN SAUH?
Masalahnya
Alat Fibonacci standard dilukis antara dua titik tetap. Sebaik sahaja harga melebihi mana-mana ekstrem, alat itu tidak lagi sah — anda perlu melukis semula secara manual. Ini mencipta kitaran pelarasan berterusan, dan peta Fibonacci tidak pernah mencerminkan julat penuh yang sebenarnya telah berkembang dengan tepat.
Terdapat isu yang lebih mendalam juga: di mana anda meletakkan sauh menentukan segala-galanya. Penempatan sewenang-wenangnya menghasilkan tahap sewenang-wenangnya.
Penyelesaiannya
Saluran Fibonacci memberi anda kawalan sengaja ke atas titik sauh — dan kemudian mengendalikan segala-galanya secara automatik dari situ. Letakkan sauh pada bar yang bermakna secara struktur (permulaan tren, pembalikan utama, pembukaan sesi), dan penunjuk membina julat penuh ke hadapan dari titik itu. Setiap tinggi atau rendah baru yang dibuat pasaran menjadi sebahagian daripada saluran. Tahap Fibonacci dikemas kini secara masa nyata.
Sauh boleh digerakkan. Gerakkan ia pada carta, dan seluruh saluran dilukis semula serta-merta.
Mengapa Pelbagai Mod?
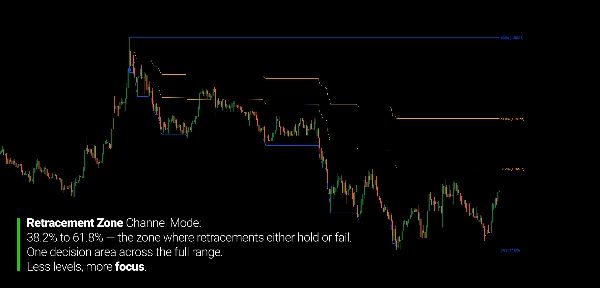
Grid Fibonacci penuh tidak selalu apa yang anda perlukan. Kadang-kadang fokus adalah pada zon retracement antara 38.2% dan 61.8%. Kadang-kadang anda mahu mengasingkan struktur hanya di separuh atas atau bawah julat.
Tujuh mod saluran yang berbeza membolehkan anda menggunakan tahap perincian yang tepat yang diperlukan oleh situasi — tanpa memenuhi carta dengan tahap yang anda tidak gunakan.
KONSEP TERAS
Penunjuk berfungsi dalam satu laluan ke hadapan dari sauh:
- Anda meletakkan ikon sauh pada bar pilihan anda
- Dari bar itu ke hadapan, penunjuk mengesan tinggi tertinggi dan rendah terendah yang berjalan
- Sempadan saluran (Garis Tinggi, Garis Rendah) mencerminkan julat yang berkembang ini
- Tahap Fibonacci dikira dalam julat, diorientasikan mengikut arah tren
- Gerakkan sauh — saluran dikira semula serta-merta
Arah tren ditentukan dengan membandingkan penutupan semasa dengan harga buka bar sauh. Bullish: tahap diukur dari atas ke bawah dari Tinggi. Bearish: tahap diukur dari bawah ke atas dari Rendah. Apabila konteks arah pasaran berubah, saluran secara automatik mengorientasikan semula.
Sauh melekat pada masa dan harga buka bar untuk penempatan yang bersih dan boleh diulang.
MOD SALURAN
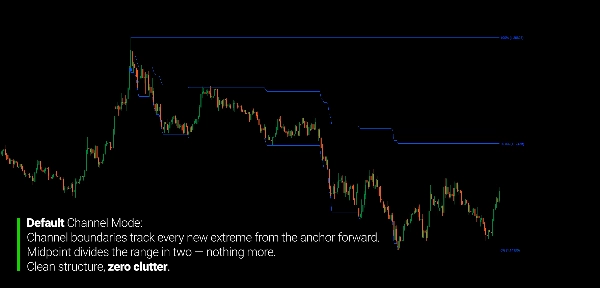
Default Hanya Garis Tinggi, Garis Rendah, dan Garis Tengah. Pandangan sempadan julat yang bersih tanpa tahap dalaman.
Zon Retracement Menambah tahap 61.8% dan 38.2% — zon retracement teras dalam julat penuh. Terbaik untuk mengenal pasti kawasan pullback utama dalam pergerakan.
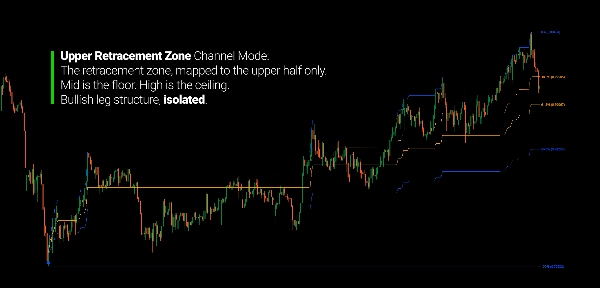
Zon Retracement Atas Zon retracement dipetakan ke separuh atas saluran (antara Mid dan High). Berguna untuk mengasingkan struktur retracement dalam kaki naik.
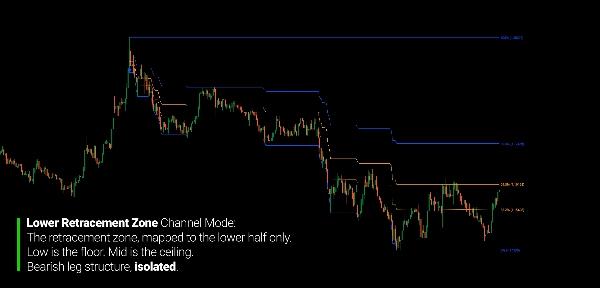
Zon Retracement Bawah Zon retracement dipetakan ke separuh bawah (antara Low dan Mid). Logik yang sama digunakan pada kaki turun.
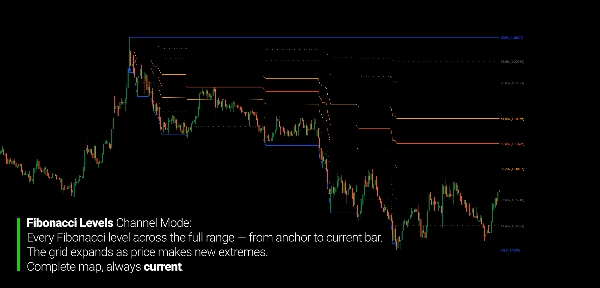
Tahap Fibonacci Grid Fibonacci penuh merentasi julat lengkap: 88.6%, 78.6%, 61.8%, 50%, 38.2%, 23.6%, 11.4%. Untuk pedagang yang mahukan peta tahap lengkap.
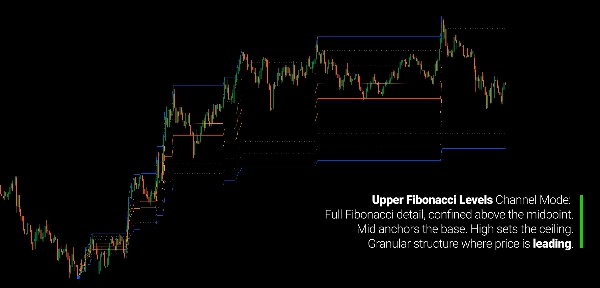
Tahap Fibonacci Atas Grid Fibonacci penuh hanya digunakan pada separuh atas saluran.
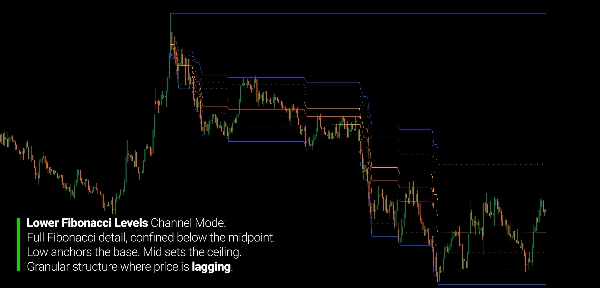
Tahap Fibonacci Bawah Grid Fibonacci penuh hanya digunakan pada separuh bawah saluran.
MEMBACA CARTA
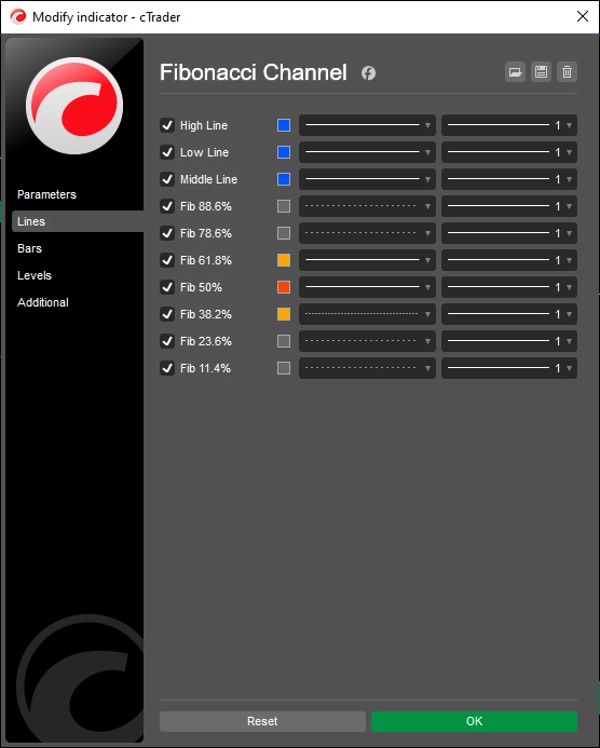
- Garis Tinggi: Sempadan atas saluran (tinggi tertinggi dari sauh)
- Garis Rendah: Sempadan bawah saluran (rendah terendah dari sauh)
- Garis Tengah: Titik tengah julat penuh
- 61.8% / 38.2%: Zon retracement teras (garis oren)
- 50%: Tahap retracement tengah (merah-oren)
- 78.6% / 88.6% / 23.6% / 11.4%: Tahap Fibonacci lanjutan (bertitik kelabu)
- Ikon Sauh: Boleh digerakkan — gerakkan untuk mentakrifkan semula di mana saluran bermula
Rujukan Arah:
- Konteks bullish → tahap diorientasikan dari atas ke bawah (Tinggi = 0%, Rendah = 100%)
- Konteks bearish → tahap diorientasikan dari bawah ke atas (Rendah = 0%, Tinggi = 100%)
- Arah dikemas kini secara automatik apabila penutupan terkini melintasi buka sauh
PARAMETER
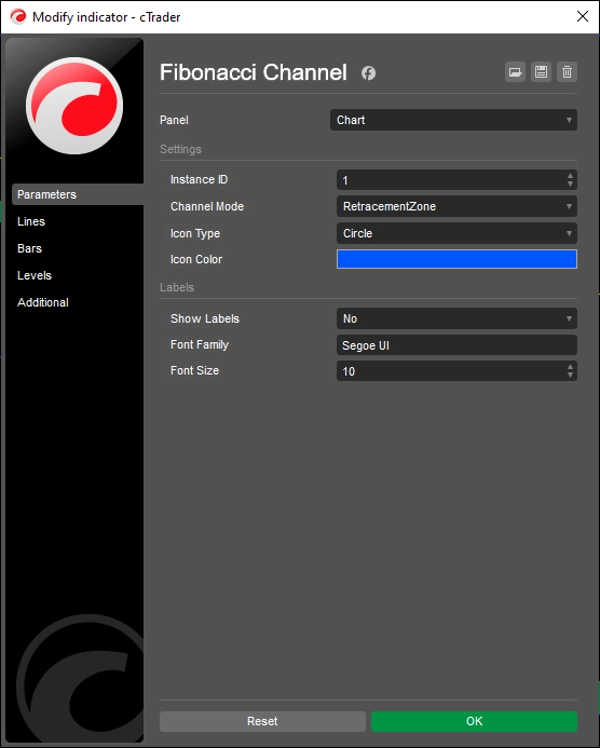
Tetapan
- ID Instans — menyokong pelbagai saluran bebas pada carta yang sama
- Mod Saluran — memilih tahap yang dipaparkan (7 mod)
- Jenis Ikon — gaya visual sauh yang boleh digerakkan
- Warna Ikon — warna penanda sauh
Label
- Tunjukkan Label — togol label harga pada setiap tahap
- Keluarga Fon — jenis huruf label
- Saiz Fon — saiz label (6–32)
SIAPA YANG SESUAI
Penunjuk ini untuk pedagang yang menggunakan analisis Fibonacci sebagai rujukan struktur dan bukan sebagai alat isyarat mekanikal.
Jika anda telah meluangkan masa melukis semula alat Fibonacci setiap kali harga membuat ekstrem baru — atau mendapati retracement statik berhenti mencerminkan pasaran selepas beberapa bar pertama — penunjuk ini dibina untuk menangani perkara itu dengan tepat.
Ia sangat sesuai untuk pedagang ayunan dan posisi yang mahukan peta Fibonacci yang kekal sah semasa harga berkembang, pedagang julat dan struktur yang bekerja dengan sempadan saluran dan zon retracement sebagai rujukan masuk atau keluar, dan pengguna multi-instans yang mahu mengesan pelbagai saluran bebas pada instrumen yang sama secara serentak.
Sauh yang boleh digerakkan menjadikannya praktikal untuk kegunaan masa nyata: tetapkan permulaan saluran pada titik yang penting secara struktur, dan biarkan penunjuk mengekalkan peta dari situ. Tiada lukisan semula, tiada kemas kini manual.
Ini bukan penjana isyarat. Ia adalah rangka rujukan struktur untuk pedagang yang menggunakan tahap Fibonacci sebagai konteks — bukan sebagai pencetus masuk.
APA YANG MEMBEZAKANNYA
Kebanyakan alat Fibonacci adalah statik: dua titik tetap, satu peta tetap. Yang ini dinamik — julat berkembang semasa harga berkembang, dan tahap sentiasa mencerminkan julat sebenar dari sauh pilihan anda ke bar semasa.
Kebanyakan pelaksanaan Fibonacci memerlukan tetapan arah manual. Yang ini membaca konteks bullish dan bearish secara automatik dan mengorientasikan semua tahap dengan sewajarnya — tanpa sebarang perubahan parameter dari pedagang.
Kebanyakan alat saluran menawarkan satu susun atur. Yang ini menawarkan tujuh mod berbeza, dari pandangan sempadan yang bersih hingga grid Fibonacci penuh yang digunakan pada julat penuh atau separuh mana-mana secara bebas. Carta menunjukkan tahap perincian yang tepat yang anda perlukan untuk konteks yang anda analisis.
Pelbagai instans boleh berjalan serentak dengan sauh bebas — masing-masing mengesan segmen struktur yang berbeza tanpa mengganggu satu sama lain.
---
MEMAHAMI STRUKTUR FIBONACCI
Nisbah Fibonacci tidak bersifat ramalan. Ia menerangkan hubungan berkadar dalam julat harga — hubungan yang telah diperhatikan oleh pedagang berulang kali merentasi pasaran dan jangka masa selama beberapa dekad. Sama ada ini mencerminkan sifat matematik pasaran atau hanya tingkah laku kolektif di sekitar tahap yang diketahui adalah persoalan terbuka. Apa yang penting untuk kegunaan praktikal adalah lebih mudah.
Saluran Fibonacci mentakrifkan julat pergerakan dan membahagikannya kepada zon yang bermakna secara berkadar. Pedagang menggunakan zon ini untuk menilai sama ada pullback cetek atau dalam, sama ada retracement bertahan atau gagal, dan sama ada harga menghampiri kawasan di mana struktur itu secara sejarah penting.
Nilai pendekatan berasaskan sauh adalah ia mengekalkan analisis berasaskan peristiwa struktur tertentu. Saluran tidak bermula pada titik sewenang-wenangnya — ia bermula di mana anda memutuskan pergerakan yang relevan bermula. Keputusan itu adalah milik anda berdasarkan bacaan carta anda. Peranan penunjuk adalah mengekalkan peta dengan tepat dari titik itu ke hadapan, supaya tahap kekal sah selagi struktur yang diukur kekal utuh.
---
Perdagangan melibatkan risiko. Penunjuk ini adalah alat analisis teknikal — sentiasa gunakan pengurusan risiko yang betul.
Ringkasan
Ulasan pelanggan
5 | 100 % | |
4 | 0 % | |
3 | 0 % | |
2 | 0 % | |
1 | 0 % |


