
Penerangan
APA YANG DILAKUKANNYA
Auto-Draw Fibonacci Suite secara automatik mengesan struktur ayunan dan melukis tujuh alat geometri secara serentak—empat alat Fibonacci ditambah tiga alat analisis geometri pelengkap—tanpa memerlukan penempatan manual.
Analisis Fibonacci tradisional bermaksud mengenal pasti ayunan, melukis retracement, melukis semula kipas dari ayunan yang sama, meletakkan pitchfork secara manual, melaraskan zon masa. Setiap alat memerlukan persediaan berasingan. Setiap ayunan baru bermakna melukis semula semuanya.
Penunjuk ini mengautomasikan keseluruhan proses itu.
Ayunan dikesan sekali melalui kaedah regresi. Semua tujuh alat geometri—retracement Fibonacci, pengembangan, kipas, dan zon masa, ditambah Andrews Pitchfork, saluran equidistant, dan kipas Gann—merujuk kepada titik ayunan yang sama secara automatik.
Apabila harga mencipta ayunan baru, setiap alat aktif dikemas kini secara masa nyata. Tiada lukisan semula. Tiada pemilihan ayunan manual. Tiada ketidakkonsistenan geometri daripada menggunakan pivot yang berbeza di antara alat.
MANFAAT UTAMA
Pendekatan Manual:
- Kenal pasti ayunan tinggi dan ayunan rendah secara visual
- Lukis retracement Fibonacci
- Kenal pasti ayunan yang sama sekali lagi, lukis kipas
- Cari tiga ayunan, letakkan pitchfork secara manual
- Harga mencipta ayunan baru → ulang keseluruhan proses
Pendekatan Auto-Draw:
- Penunjuk mengesan ayunan secara automatik
- Semua tujuh alat melukis dan mengemas kini sendiri
- Harga mencipta ayunan baru → semuanya dikemas kini secara automatik
- Perbezaannya adalah struktur. Daripada tujuh aliran kerja manual berasingan, anda mempunyai satu sistem pengesanan automatik yang memproyeksikan merentasi semua domain geometri—alat berasaskan Fibonacci untuk analisis nisbah dan tiga rangka kerja geometri tambahan untuk pemetaan struktur pasaran yang komprehensif.
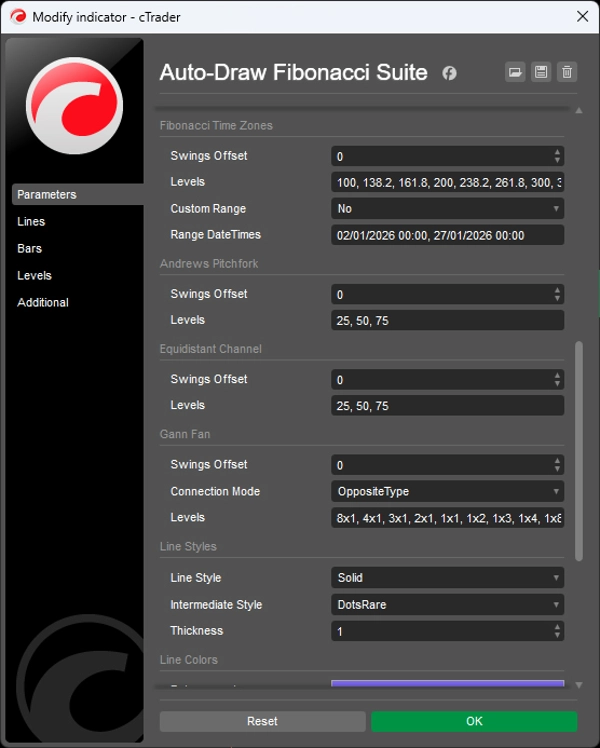
PAKET ALAT
Empat Alat Fibonacci:
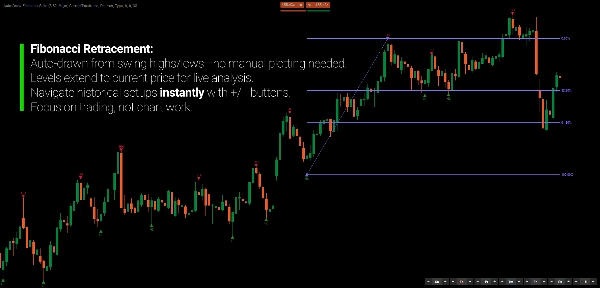
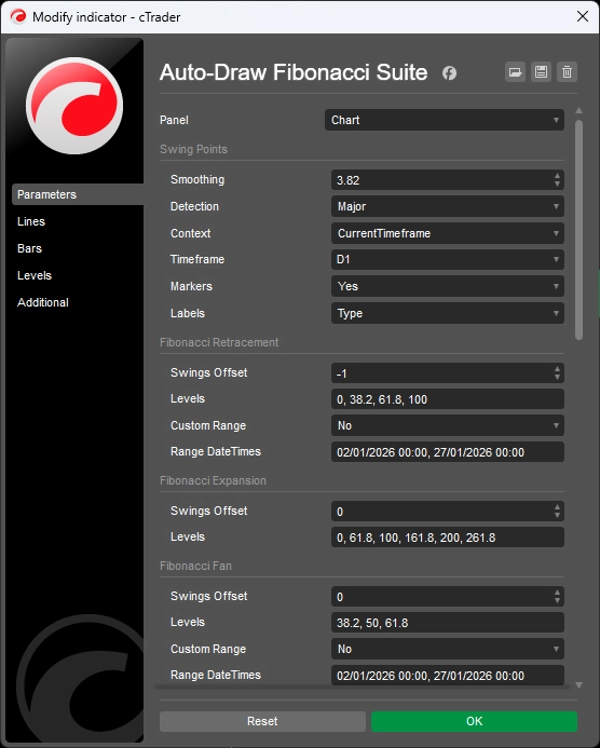
- Retracement Fibonacci — tahap mendatar (0%, 38.2%, 61.8%, 100%)
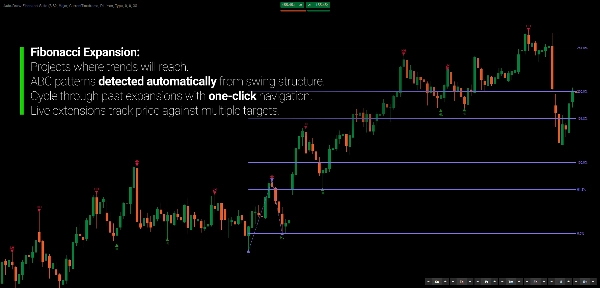
- Pengembangan Fibonacci — sasaran unjuran melebihi ayunan ketiga
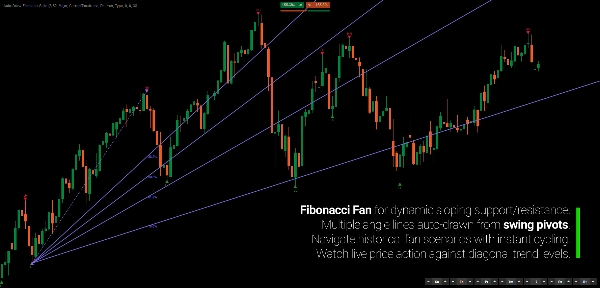
- Kipas Fibonacci — garis tren serong dari titik pivot
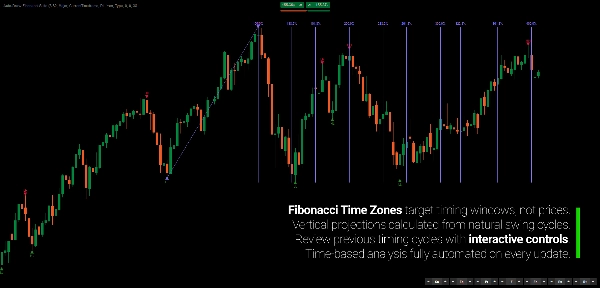
- Zon Masa Fibonacci — unjuran masa menegak
Tiga Alat Geometri Pelengkap:
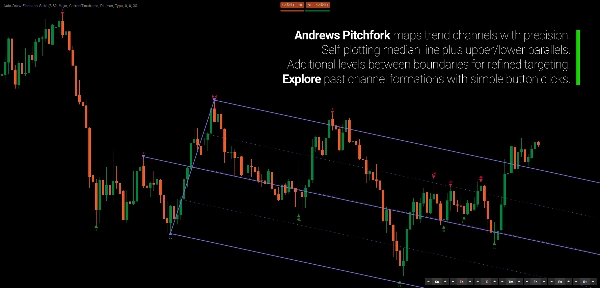
- Andrews Pitchfork — median tiga titik dengan saluran selari
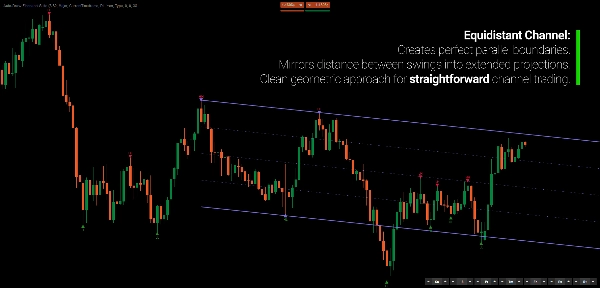
- Saluran Equidistant — saluran selari dengan tahap perantaraan
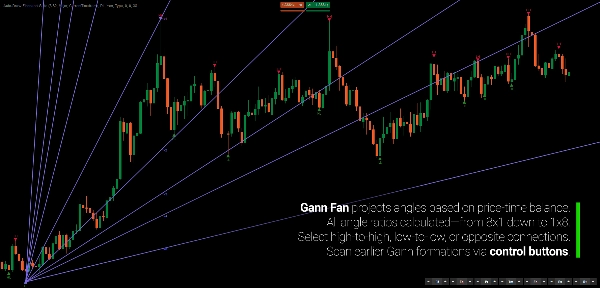
- Kipas Gann — unjuran sudut harga-ke-masa (8x1, 4x1, 2x1, 1x1, 1x2…)
Setiap alat boleh diaktifkan secara berasingan. Semua merujuk kepada pengesanan ayunan asas yang sama.
PENGESANAN AYUNAN BERSATU
Tiga mod pengesanan mengawal kepekaan ayunan:
- Utama — ayunan lebih sedikit, lebih kuat (disahkan oleh penutupan)
- Standard — ketepatan seimbang (paling biasa)
- Kecil — mengesan ayunan dalaman dalam tren (perincian maksimum)
Ayunan diklasifikasikan secara automatik (HH/LL/LH/HL) dan diukur berdasarkan kedalaman, volum, dan tempoh. Penanda visual menunjukkan ayunan yang disahkan (segitiga), ayunan yang tidak disahkan (bulatan), dan ayunan dalaman (segi empat).
KAWALAN OFFSET INTERAKTIF
Tujuh kumpulan butang (satu bagi setiap alat) membolehkan anda segera melaraskan ayunan sejarah mana yang digunakan oleh setiap unjuran geometri:
- 0 — struktur ayunan terkini
- -1 — struktur sebelumnya
- -2 — dua struktur ke belakang
Berjalan mundur melalui sejarah ayunan untuk melihat bagaimana hubungan geometri berkembang pada titik struktur sebelumnya. Tukar ayunan rujukan mana-mana alat tanpa menjejaskan yang lain.
SOKONGAN PELBAGAI JANGKA MASA
Gunakan pengesanan ayunan pada jangka masa lebih tinggi sambil melihat carta jangka masa lebih rendah. Lihat ayunan Harian dan semua unjuran geometri pada carta H1 anda—tiada keperluan menukar jangka masa.
CIRI-CIRI UTAMA
- Pengesanan ayunan automatik melalui metodologi regresi
- Tujuh alat geometri dilukis secara automatik dari rujukan ayunan bersatu
- Kemas kini masa nyata apabila ayunan baru terbentuk
- Kawalan offset interaktif untuk setiap alat
- Mod pelbagai jangka masa (analisis Harian, dagangan H1)
- Tiga mod pengesanan (Utama/Standard/Kecil)
- Klasifikasi ayunan (HH/LL/LH/HL) dan metrik
- Pengelompokan ayunan pintar (menghapuskan ayunan perantaraan berlebihan)
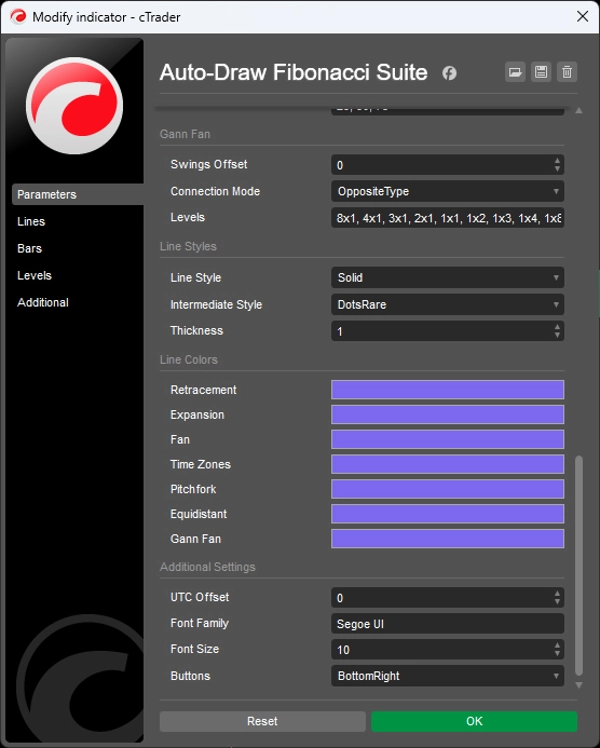
- Tahap, warna, gaya yang boleh disesuaikan sepenuhnya
- Ayunan sumber yang diserlahkan untuk alat aktif
SIAPA YANG SESUAI
Penunjuk ini untuk pedagang yang memahami alat analisis Fibonacci dan geometri tetapi tidak mahu meluangkan masa meletakkan dan melukis semula secara manual.
Jika anda menggunakan pelbagai unjuran Fibonacci dan sentiasa melukis semula apabila harga berkembang—atau mengelakkan alat tertentu kerana penempatan manual terlalu membosankan—suite ini mengautomasikan aliran kerja itu.
Ia sesuai untuk pedagang ayunan dan posisi yang memerlukan rujukan geometri merentasi pelbagai alat, penganalisis pelbagai jangka masa yang mahukan struktur jangka masa lebih tinggi pada carta pelaksanaan, dan pedagang budi bicara yang menghargai konfluens geometri tetapi tidak beban pengurusan alat manual.
Ini bukan sistem isyarat. Ia adalah alat automasi untuk pedagang yang sudah berfikir dalam istilah Fibonacci dan geometri dan mahu analisis mereka dikemas kini sendiri.
APA YANG MEMBEZAKANNYA
Kebanyakan penunjuk analisis geometri melukis satu jenis alat. Suite ini melukis tujuh serentak dari pengesanan ayunan bersatu.
Kebanyakan memerlukan pemilihan ayunan manual. Ini mengautomasikan pengenalpastian ayunan dan mengemas kini semua alat secara masa nyata.
Kebanyakan mengendalikan setiap alat secara berasingan. Ini mengekalkan koheren geometri dengan memastikan semua unjuran merujuk kepada struktur asas yang sama.
Hasilnya: analisis geometri pelbagai rangka kerja lengkap tanpa lukisan semula berterusan.
---
MEMAHAMI FIBONACCI SEBAGAI BAHASA GEOMETRI
Analisis Fibonacci sering disalahfahami sebagai ramalan—seolah-olah pasaran "menghormati" nisbah tertentu. Ini terlepas prinsip asas.
Nisbah Fibonacci tidak meramalkan ke mana harga akan pergi. Ia menyediakan kosa kata geometri standard untuk menerangkan bagaimana harga bergerak berkaitan dengan struktur sebelumnya. Retracement ke 61.8% mewakili hubungan geometri antara pembetulan semasa dan impuls sebelumnya—bukan "sokongan" dalam erti sebab-akibat.
Nilainya terletak pada koheren geometri, bukan tahap individu. Apabila pelbagai unjuran bertemu—tahap retracement sejajar dengan sudut kipas dan zon masa—pertemuan itu mencerminkan konsistensi struktur merentasi domain pengukuran yang berbeza.
Pasaran tidak menyasarkan tahap Fibonacci. Apabila unjuran geometri sejajar, penjajaran itu mendedahkan susunan struktur asas. Inilah sebabnya tahap terpencil mempunyai nilai terhad manakala struktur geometri yang bertemu sering menandakan titik infleksi.
Geometri bukan penyebabnya. Ia adalah bahasa deskriptif hubungan struktur.
---
Perdagangan melibatkan risiko. Penunjuk ini adalah alat analisis teknikal—sentiasa gunakan pengurusan risiko yang betul.


