Opis
CO ROBI
Auto-Draw Fibonacci Suite automatycznie wykrywa struktury swingów i rysuje jednocześnie siedem narzędzi geometrycznych— cztery narzędzia Fibonacciego plus trzy uzupełniające narzędzia analizy geometrycznej —bez konieczności ręcznego umieszczania.
Tradycyjna analiza Fibonacciego oznacza identyfikację swingów, rysowanie poziomów zniesień, ponowne rysowanie wachlarzy z tych samych swingów, ręczne umieszczanie wideł Andrewsa, dostosowywanie stref czasowych. Każde narzędzie wymaga osobnej konfiguracji. Każdy nowy swing oznacza konieczność ponownego rysowania wszystkiego.
Ten wskaźnik automatyzuje cały ten proces.
Swingi są wykrywane raz za pomocą metody regresji. Wszystkie siedem narzędzi geometrycznych — zniesienie Fibonacciego, ekspansja, wachlarz i strefy czasowe, plus widełki Andrewsa, kanał równoległy i wachlarz Ganna — automatycznie odwołują się do tych samych punktów swingów.
Gdy cena tworzy nowy swing, każde aktywne narzędzie aktualizuje się w czasie rzeczywistym. Bez ponownego rysowania. Bez ręcznego wyboru swingów. Bez niespójności geometrycznych wynikających z używania różnych punktów zwrotnych w różnych narzędziach.
GŁÓWNA KORZYŚĆ
Podejście ręczne:
- Wizualna identyfikacja swing high i swing low
- Rysowanie zniesienia Fibonacciego
- Ponowna identyfikacja tych samych swingów, rysowanie wachlarza
- Znajdowanie trzech swingów, ręczne umieszczanie widełek Andrewsa
- Cena tworzy nowy swing → powtarzanie całego procesu
Podejście Auto-Draw:
- Wskaźnik automatycznie wykrywa swingi
- Wszystkie siedem narzędzi rysuje się i aktualizuje samoistnie
- Cena tworzy nowy swing → wszystko aktualizuje się automatycznie
- Różnica jest strukturalna. Zamiast siedmiu oddzielnych, ręcznych procesów masz jeden zautomatyzowany system wykrywania działający we wszystkich domenach geometrycznych — narzędzia oparte na Fibonaccim do analizy stosunków oraz trzy dodatkowe ramy geometryczne do kompleksowego mapowania struktury rynku.
ZESTAW NARZĘDZI
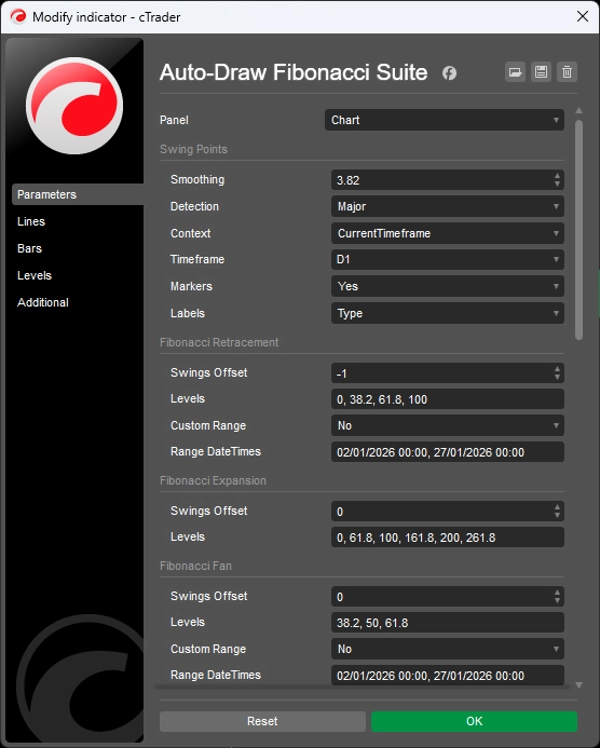
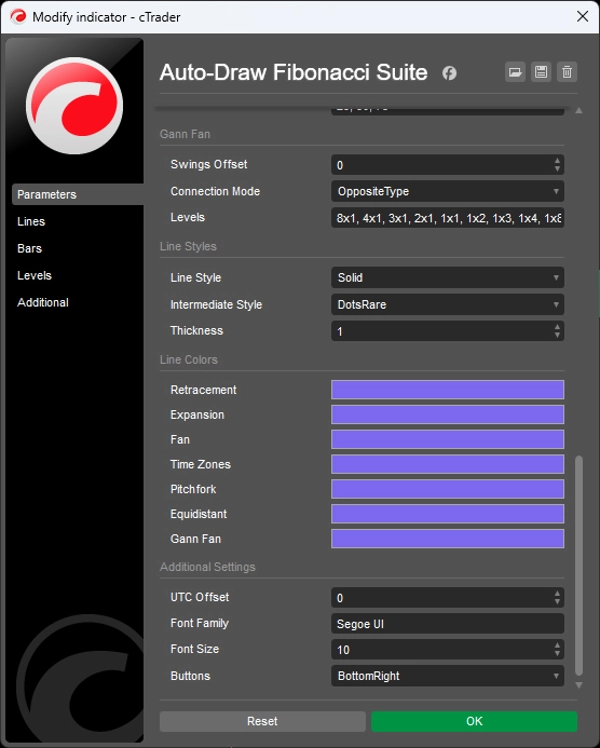
Cztery narzędzia Fibonacciego:
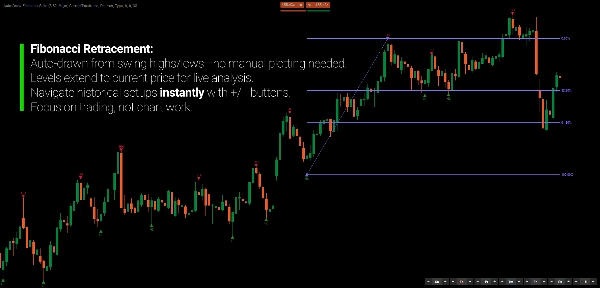
- Zniesienie Fibonacciego — poziomy poziome (0%, 38,2%, 61,8%, 100%)
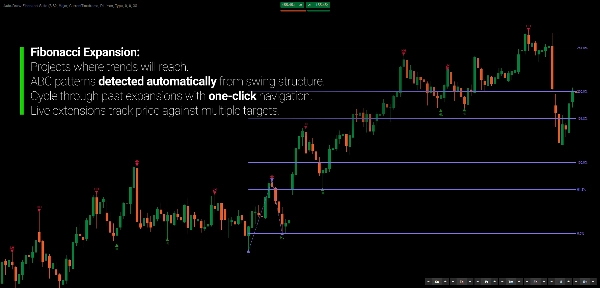
- Ekspansja Fibonacciego — cele projekcji poza trzecim swingiem
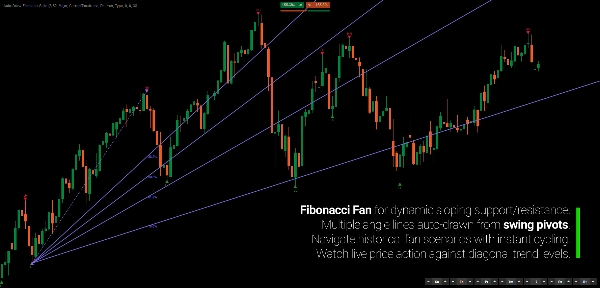
- Wachlarz Fibonacciego — ukośne linie trendu z punktów zwrotnych
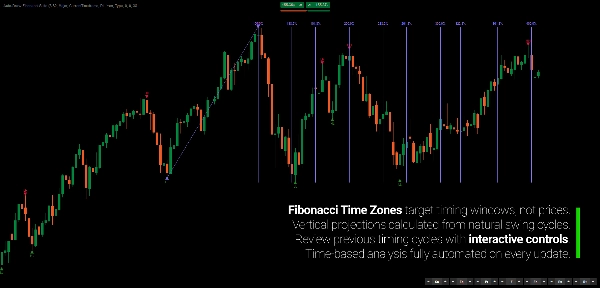
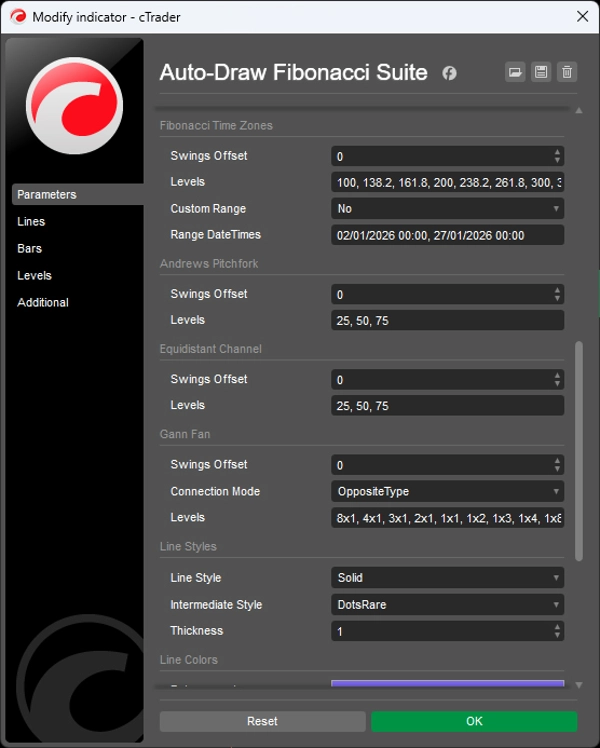
- Strefy czasowe Fibonacciego — pionowa projekcja czasu
Trzy uzupełniające narzędzia geometryczne:
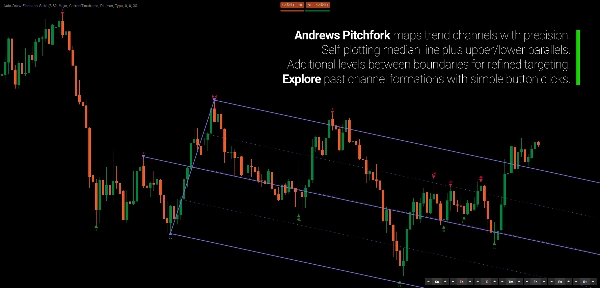
- Widełki Andrewsa — mediany trójpunktowe z równoległymi kanałami
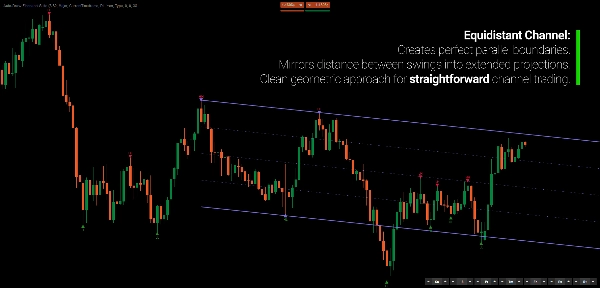
- Kanał równoległy — równoległy kanał z poziomami pośrednimi
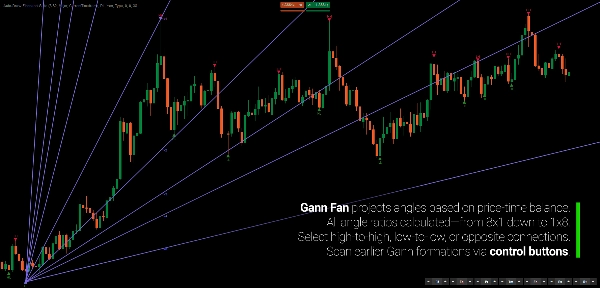
- Wachlarz Ganna — projekcje kątów cena-czas (8x1, 4x1, 2x1, 1x1, 1x2…)
Każde narzędzie można włączyć niezależnie. Wszystkie odwołują się do tej samej podstawowej detekcji swingów.
UNIWERSALNE WYKRYWANIE SWINGÓW
Trzy tryby wykrywania kontrolują czułość swingów:
- Główne — mniej, silniejszych swingów (potwierdzonych zamknięciami)
- Standardowe — zrównoważona szczegółowość (najczęstsze)
- Drobne — wykrywa wewnętrzne swingi w trendach (maksymalna szczegółowość)
Swingi są automatycznie klasyfikowane (HH/LL/LH/HL) i mierzone pod względem głębokości, wolumenu i czasu trwania. Wizualne markery pokazują potwierdzone swingi (trójkąty), niepotwierdzone (kółka) oraz wewnętrzne (kwadraty).
INTERAKTYWNE KONTROLKI PRZESUNIĘCIA
Siedem grup przycisków (po jednej na narzędzie) pozwala natychmiast dostosować, które historyczne swingi wykorzystuje każda projekcja geometryczna:
- 0 — najnowsza struktura swingów
- -1 — poprzednia struktura
- -2 — dwie struktury wstecz
Przechodź wstecz przez historię swingów, aby zobaczyć, jak ewoluowały relacje geometryczne w poprzednich punktach strukturalnych. Zmieniaj odniesienia swingów dla dowolnego narzędzia bez wpływu na inne.
OBSŁUGA WIELU INTERWAŁÓW CZASOWYCH
Stosuj wykrywanie swingów na wyższym interwale czasowym, jednocześnie oglądając wykres na niższym interwale. Zobacz swingi dzienne i wszystkie projekcje geometryczne na wykresie H1 — bez potrzeby zmiany interwału.
KLUCZOWE CECHY
- Automatyczne wykrywanie swingów metodą regresji
- Siedem narzędzi geometrycznych rysowanych automatycznie z jednolitych odniesień swingów
- Aktualizacje w czasie rzeczywistym przy powstawaniu nowych swingów
- Interaktywne kontrolki przesunięcia dla każdego narzędzia
- Tryb wielointerwałowy (analiza dzienna, handel H1)
- Trzy tryby wykrywania (Główne/Standardowe/Drobne)
- Klasyfikacja swingów (HH/LL/LH/HL) i metryki
- Inteligentne grupowanie swingów (eliminacja zbędnych swingów pośrednich)
- W pełni konfigurowalne poziomy, kolory, style
- Wyróżnione źródłowe swingi dla aktywnych narzędzi
DLA KOGO JEST TEN WSKAŹNIK
Ten wskaźnik jest dla traderów, którzy rozumieją narzędzia analizy Fibonacciego i geometrycznej, ale nie chcą tracić czasu na ręczne umieszczanie i ponowne rysowanie ich.
Jeśli używasz wielu projekcji Fibonacciego i stale je rysujesz na nowo w miarę rozwoju ceny — lub unikasz niektórych narzędzi, ponieważ ręczne umieszczanie jest zbyt uciążliwe — ten zestaw automatyzuje ten proces.
Jest dobrze dopasowany do traderów swingowych i pozycyjnych, którzy potrzebują geometrycznych odniesień w wielu narzędziach, analityków wielointerwałowych, którzy chcą mieć strukturę wyższego interwału na wykresach wykonawczych, oraz traderów dyskrecjonalnych, którzy cenią geometryczną konfluencję, ale nie chcą obciążenia ręcznym zarządzaniem narzędziami.
To nie jest system sygnałowy. To narzędzie automatyzujące dla traderów, którzy już myślą w kategoriach Fibonacciego i geometrii i chcą, aby ich analiza aktualizowała się sama.
CO GO WYRÓŻNIA
Większość wskaźników analizy geometrycznej rysuje jeden typ narzędzia. Ten zestaw rysuje siedem jednocześnie z jednolitego wykrywania swingów.
Większość wymaga ręcznego wyboru swingów. Ten automatyzuje identyfikację swingów i aktualizuje wszystkie narzędzia w czasie rzeczywistym.
Większość traktuje każde narzędzie niezależnie. Ten zachowuje spójność geometryczną, zapewniając, że wszystkie projekcje odnoszą się do tych samych podstawowych struktur.
Efekt: kompletna analiza geometryczna w wielu ramach bez ciągłego rysowania na nowo.
---
ZROZUMIENIE FIBONACCIEGO JAKO JĘZYKA GEOMETRYCZNEGO
Analiza Fibonacciego jest często błędnie rozumiana jako predykcyjna — jakby rynki „szanowały” pewne proporcje. To pomija fundamentalną zasadę.
Proporcje Fibonacciego nie przewidują, dokąd pójdzie cena. Dostarczają ustandaryzowany słownik geometryczny do opisywania, jak cena porusza się w odniesieniu do wcześniejszej struktury. Zniesienie do 61,8% reprezentuje relację geometryczną między obecną korektą a wcześniejszym impulsem — nie „wsparcie” w sensie przyczynowym.
Wartość leży w spójności geometrycznej, nie w pojedynczych poziomach. Gdy wiele projekcji zbiega się — poziom zniesienia pokrywający się z kątem wachlarza i strefą czasową — ta zbieżność odzwierciedla spójność strukturalną w różnych domenach pomiarowych.
Rynki nie celują w poziomy Fibonacciego. Gdy projekcje geometryczne się pokrywają, to pokrycie ujawnia podstawowy porządek strukturalny. Dlatego izolowane poziomy mają ograniczoną wartość, podczas gdy zbieżne struktury geometryczne często oznaczają punkty zwrotne.
Geometria nie jest przyczyną. To język opisowy relacji strukturalnych.
---
Trading wiąże się z ryzykiem. Ten wskaźnik jest narzędziem analizy technicznej — zawsze stosuj odpowiednie zarządzanie ryzykiem.


