Opis
🚀 Volume Profile Pro dla cTrader
Odkryj prawdziwą strukturę stojącą za ruchem cen dzięki Volume Profile Pro, potężnemu i w pełni konfigurowalnemu wskaźnikowi Wolumenu według ceny, zaprojektowanemu specjalnie dla profesjonalnych traderów cTrader.
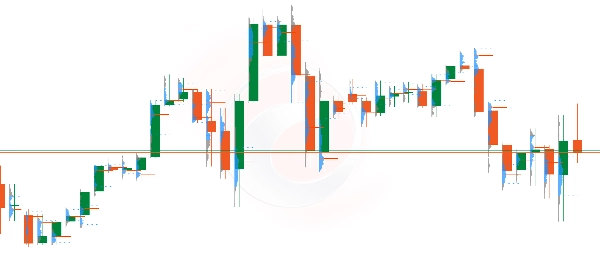
To zaawansowane narzędzie wizualizuje indywidualne profile wolumenu dla wybranego okresu czasowego, pozwalając zobaczyć dokładnie, gdzie skoncentrowana jest aktywność instytucjonalna — bezpośrednio na wykresie.
🔎 Co robi
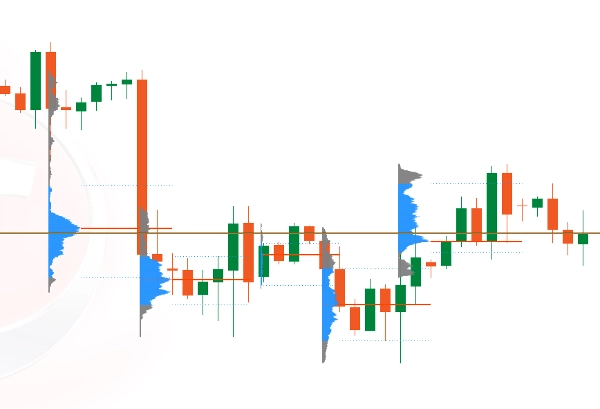
Volume Profile Pro oblicza i wyświetla rozkład wolumenu w stałym zakresie dla każdego zakończonego okresu (H1, M15, D1 itd.), nanosząc go bezpośrednio na oś cen dla precyzyjnej analizy strukturalnej.
Każdy profil:
- Jest rysowany indywidualnie dla każdego okresu
- Używa spójnego, stałego zakresu cen
- Wyświetla rozkład wolumenu na poziomie cenowym
- Podkreśla kluczowe poziomy instytucjonalne
Profile są umieszczone czysto po lewej stronie każdej świecy, zapewniając wyraźne rozpoznanie struktury bez zasłaniania ruchu cen.
⚡ Kluczowe funkcje
✔ Indywidualne profile wolumenu dla każdego okresu czasowego
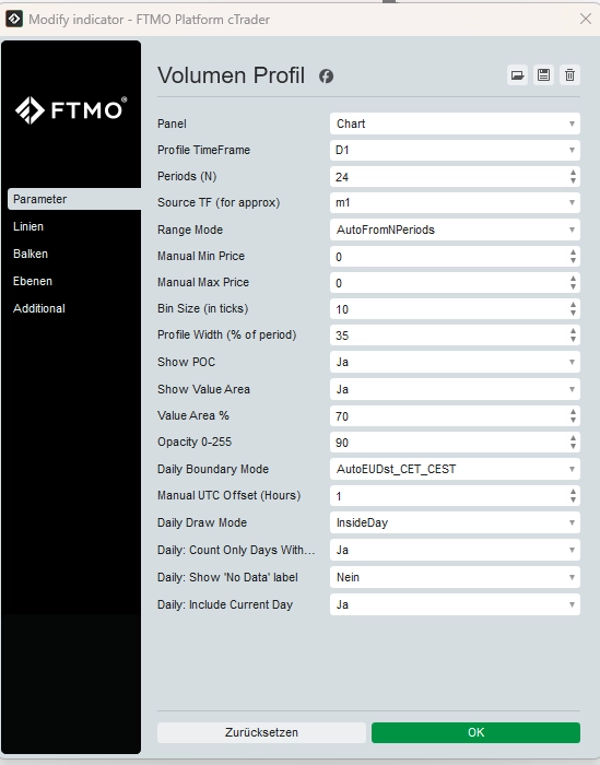
✔ Możliwość wyboru okresu profilu (M15, H1, H4, D1 itd.)
✔ Stały zakres cen (automatyczny lub ręczny)
✔ Podświetlenie Punktu Kontroli (POC)
✔ Wartość obszaru wysokiego (VAH) i niskiego (VAL)
✔ Płynne renderowanie bez migotania wykresu
✔ W pełni zoptymalizowany pod kątem wydajności
✔ Zaprojektowany dla środowisk CFD i wolumenu Tick
📊 Dlaczego traderzy go używają
- Identyfikacja stref akumulacji i dystrybucji instytucjonalnej
- Wykrywanie poziomów reakcji o wysokim prawdopodobieństwie
- Potwierdzanie siły wybicia
- Doprecyzowanie wejść w zakresach konsolidacji
- Dopasowanie struktury wolumenu do ruchu cen
Niezależnie czy jesteś skalperem, traderem intraday czy swingowym, Volume Profile Pro daje Ci przewagę strukturalną.
⚠ Ważne zastrzeżenie
Volume Profile to narzędzie do handlu i nie stanowi porady finansowej ani inwestycyjnej.
Handel na rynku Forex, CFD i innymi instrumentami finansowymi wiąże się z dużym ryzykiem i może skutkować utratą kapitału.
🎯 Stworzony dla precyzji. Zaprojektowany dla profesjonalistów.
Podnieś swoją analizę struktury rynku na wyższy poziom i handluj z jasnością, pewnością i kontrolą.
Podsumowanie
Opinie klientów
5 | 100 % | |
4 | 0 % | |
3 | 0 % | |
2 | 0 % | |
1 | 0 % |