
Opis
RiskLotSizer to wskaźnik do określania wielkości pozycji i zarządzania ryzykiem oparty na wykresie dla cTrader, zaprojektowany, aby pomóc traderom szybko i wizualnie obliczyć odpowiedni rozmiar transakcji.
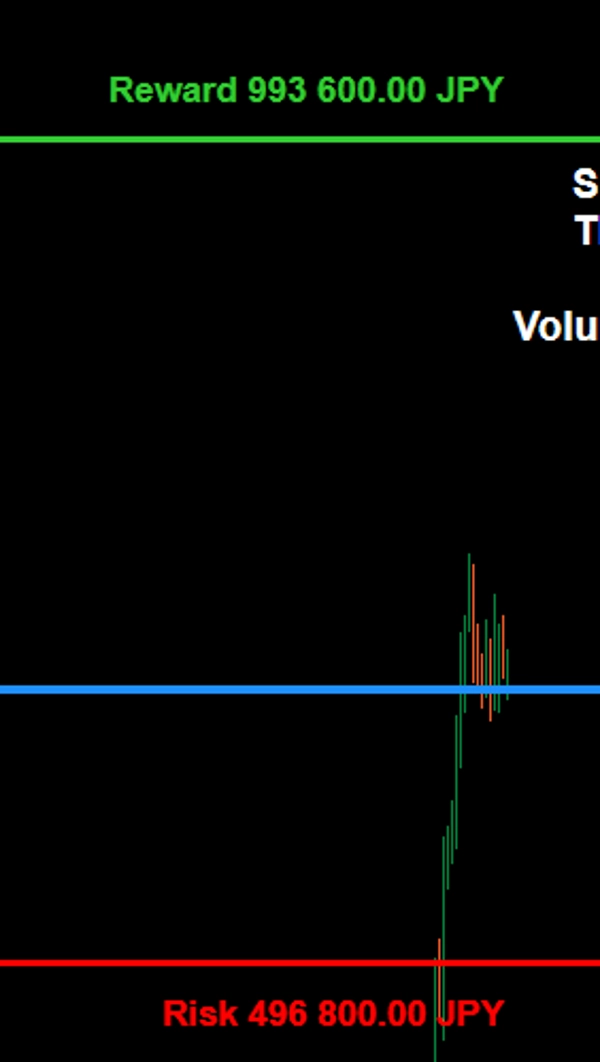
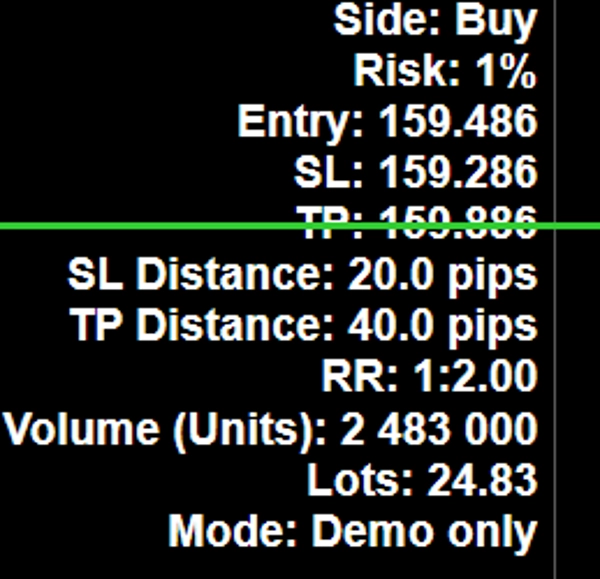
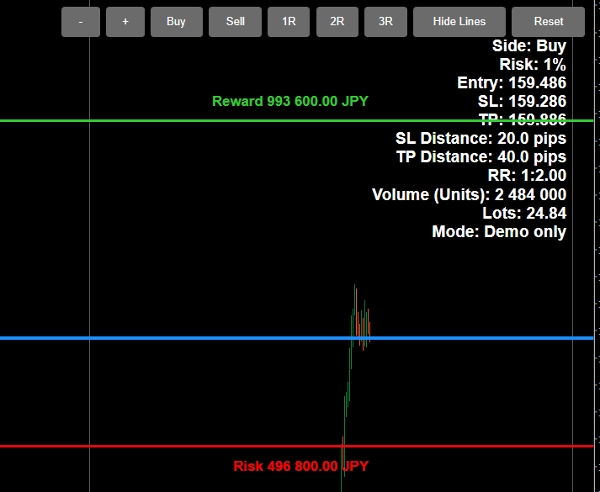
Wskaźnik pozwala na dostosowanie poziomów Wejścia, Stop Loss i Take Profit bezpośrednio na wykresie, co ułatwia planowanie transakcji w czasie rzeczywistym. Na podstawie wybranego procentowego ryzyka od kapitału konta, RiskLotSizer automatycznie oblicza wielkość pozycji i wyświetla szacowaną wielkość lota, kwotę ryzyka, kwotę zysku oraz stosunek ryzyka do zysku.
Obsługuje zarówno scenariusze Kupna, jak i Sprzedaży, i jest zaprojektowany, aby dać traderom wyraźny wizualny przegląd ryzyka transakcji przed zajęciem pozycji. Wartości ryzyka i zysku są wyświetlane bezpośrednio obok linii SL i TP, podczas gdy główny panel informacyjny zapewnia przejrzyste podsumowanie ustawień.
Kluczowe cechy obejmują:
- Obliczanie wielkości lota na podstawie wybranego procentu kapitału
- Regulowane linie Wejścia, SL i TP bezpośrednio na wykresie
- Wyświetlanie w czasie rzeczywistym wielkości pozycji, kwoty ryzyka, kwoty zysku i stosunku RR
- Wsparcie dla trybów Kupna i Sprzedaży
- Szybkie przyciski presetów RR dla szybszego planowania transakcji
- Wsparcie języka angielskiego i japońskiego
- Przełącznik widoczności linii dla czystszego wykresu w razie potrzeby
RiskLotSizer jest idealny dla traderów dyskrecjonalnych, day traderów oraz wszystkich, którzy chcą szybszego i bardziej przejrzystego sposobu określania wielkości pozycji przy zachowaniu konsekwentnej kontroli ryzyka.
RiskLotSizer は、チャート上で直感的にポジションサイズを計算できる cTrader 用のポジションサイジング・リスク管理インジケーターです。
Entry、Stop Loss、Take Profit の各ラインをチャート上で直接動かしながら、指定した有効証拠金比率に基づく適正ロット数を自動計算します。これにより、トレード前に必要なロット数、想定損失額、想定利益額、Risk/Reward をリアルタイムで把握できます。
Buy / Sell の両方に対応しており、RR プリセットボタンによって利確目標の調整も素早く行えます。また、SL・TP 付近には損失額・利益額が表示されるため、視覚的にも分かりやすく、実践的なトレード設計をサポートします。
主な特長:
- 有効証拠金に対する指定リスク率からロット数を自動計算
- Entry / SL / TP をチャート上で直接調整可能
- ロット数、損失額、利益額、RR をリアルタイム表示
- Buy / Sell の両方に対応
- RR プリセットボタン搭載
- 英語 / 日本語切替対応
- 必要に応じてライン表示の ON / OFF が可能
RiskLotSizer は、裁量トレーダー、デイトレーダー、そして一貫したリスク管理を重視するトレーダーに適したインジケーターです。
Podsumowanie
Opinie klientów
5 | 0 % | |
4 | 100 % | |
3 | 0 % | |
2 | 0 % | |
1 | 0 % |


![Logo „[Stellar Strategies] Inside Bar with Signals”](https://cdn.ctrader.com/image/webp/1d9e8bfa-3b2c-4440-bb37-5856902008a7_30683)


