present
Zarejestruj się i otrzymaj 50 $ zniżki na pierwszy zakup
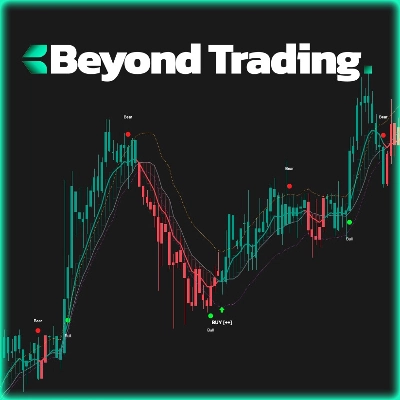
Trading product for Smart Support Resistance Break Detector Wskaźnik Key Levels BOS, image 1
Smart Support Resistance Break Detector
Wskaźnik
117 pobrania
Wersja 1.0, Apr 2026
Windows, Mac
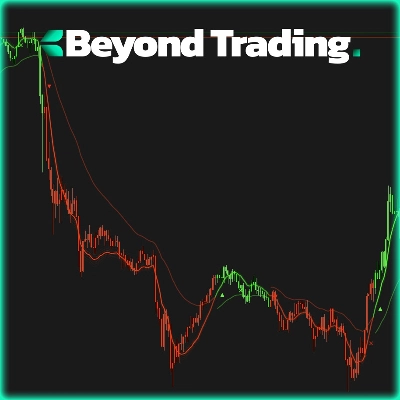
Trading product for Smart Support Resistance Break Detector Wskaźnik Key Levels BOS, image 2
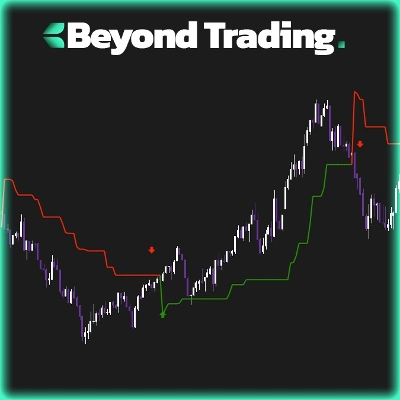
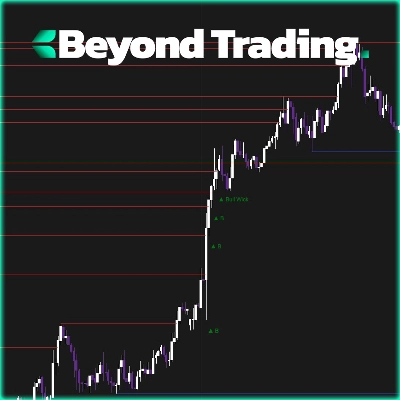
Trading product for Smart Support Resistance Break Detector Wskaźnik Key Levels BOS, image 3
Od 21/01/2026
4
Sprzedaż
214
Bezpłatne instalacje

Opis

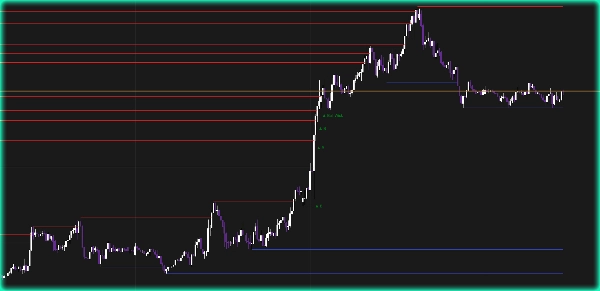
Poziomy wsparcia i oporu z wybiciami od [BeyondTrading] — Zobacz każdy aktywny poziom i każde prawdziwe wybicie. Automatycznie wykrywa lokalne maksima i minima oraz rysuje poziome linie wsparcia i oporu bezpośrednio na wykresie. Każda linia rozciąga się słupek po słupku w czasie rzeczywistym, dopóki poziom jest utrzymywany. W momencie, gdy cena zamyka się przez niego, linia zatrzymuje się — dokładnie w punkcie kontaktu. Brak ręcznego rysowania, brak przestarzałych poziomów zaśmiecających wykres.

Gdy poziom zostaje przebity, natychmiast pojawia się sygnał: B dla czystego wybicia z wolumenem, Bull Wick lub Bear Wick gdy zamknięcie jest napędzane knotem, a nie faktycznym zamknięciem korpusu świecy. Filtr wolumenu eliminuje ruchy o niskiej wiarygodności i pozostawia tylko istotne sygnały.

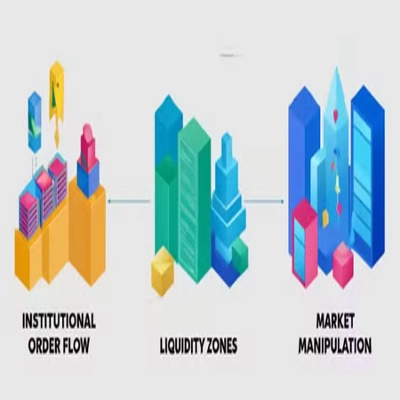
Dlaczego poziomy wsparcia i oporu są ważne Poziomy wsparcia i oporu to nie tylko linie — to pule płynności. Za każdym razem, gdy cena odrzuciła poziom, zlecenia stop i zlecenia oczekujące gromadzą się tuż powyżej i poniżej niego. Gdy cena wraca, instytucje albo bronią poziomu, albo polują na stop losy tam umieszczone, zanim zacznie się prawdziwy ruch. Poziom oporu, który był testowany trzy razy i nigdy nie został przebity, nie jest przypadkowy — to miejsce, gdzie gromadzą się zlecenia sprzedaży i gdzie traderzy breakout mogą zostać uwięzieni, jeśli ruch jest fałszywy. Znajomość, które poziomy są nadal aktywne, a które zostały już pokonane, mówi dokładnie, gdzie prawdopodobnie nastąpi kolejna reakcja.

Funkcje

  • Wykrywanie pivotów z konfigurowalnymi lewymi i prawymi słupkami dla dowolnego stylu handlu
  • Linie rozciągają się dynamicznie na każdym słupku — zatrzymują się w momencie, gdy cena zamyka się przez nie
  • Filtr wolumenu (oscylator EMA 5/10) do rozróżniania prawdziwych wybicia od szumu
  • Etykiety wybicia: B dla czystych wybicia z wolumenem, Bull Wick i Bear Wick dla ruchów napędzanych knota
  • Filtrowanie duplikatów — poziomy zbyt blisko istniejących są automatycznie ignorowane
  • Maksymalna liczba aktywnych poziomów po każdej stronie, aby wykres był czysty i czytelny
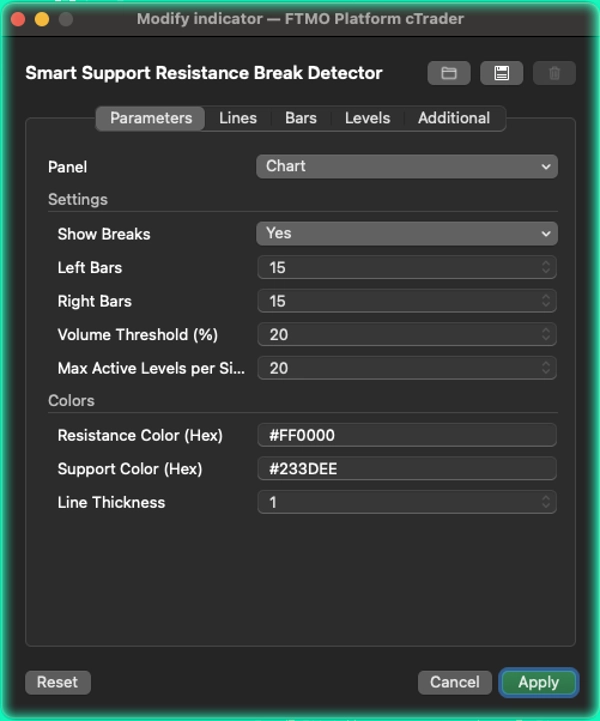
  • W pełni konfigurowalne kolory oporu i wsparcia z możliwością wprowadzania wartości hex

Podsumowanie

Podsumowanie AI
The Smart Support Resistance Break Detector is an indicator that automatically identifies pivot-based support and resistance levels on trading charts. It detects pivot highs and lows and draws horizontal lines that extend in real time as long as the price respects these levels. When the price closes beyond a level, the corresponding line stops exactly at the breakout point, preventing clutter from outdated levels.

The indicator features volume-confirmed break signals to distinguish genuine breakouts from low-conviction moves. It displays specific labels: "B" for clean volume breaks, and "Bull Wick" or "Bear Wick" when breaks are driven by wicks rather than body closes. A volume filter based on EMA oscillators helps filter out noise.

Additional functionalities include configurable pivot detection parameters (Left Bars and Right Bars), automatic filtering of duplicate levels, and limits on the maximum number of active levels per side to maintain chart clarity. Users can customize support and resistance line colors using hex codes.

This tool is designed to highlight key liquidity pools where institutional orders accumulate, aiding traders in identifying active levels and potential reaction points in the market.
Profil wskaźnika

Opinie klientów

0.0
Opinie: 0
Opinie klientów
Ten produkt nie ma jeszcze opinii. Wypróbowałeś(-aś) go już? Bądź pierwszy(-a) i powiedz o tym innym!

Dyskusja

Częste pytania

Key Levels
BOS
Liquidity Sweep
Liquidity Grab
Support & Resistance
Produkty dostępne za pośrednictwem cTrader Store, w tym boty handlowe, wskaźniki i wtyczki, dostarczane są przez deweloperów zewnętrznych i udostępniane wyłącznie w celach informacyjnych oraz w celu zapewnienia dostępu technicznego. cTrader Store nie jest brokerem i nie zapewnia doradztwa inwestycyjnego, nie udziela spersonalizowanych rekomendacji ani nie gwarantuje przyszłych wyników.

Więcej od tego autora

Wskaźnik
EMA
SMA
+2
Exhaustion Hunter by BeyondTrading — When price hits the limit, the reversal is next.
Wskaźnik
Prop
Forex
+5
Tracks NY, London, Tokyo, Sydney sessions with custom visuals, and a real-time expanding range box and breakout High/Low
Wskaźnik
EMA
AI-assisted
+1
Multi EMA Timeframes lets you stay on your chart and see the exact EMA from any timeframe you choose — up to 5 at once.
Wskaźnik
ATR
EMA
+2
Adaptive Entropy Trend reads market randomness to filter noise from direction. Smooth trend line, automatic bar coloring
Wskaźnik
ATR
EMA
+4
Reads trend acceleration, not just direction. Glowing lead line, dynamic channel, auto flip levels.
Wskaźnik
RSI
VWAP
+3
Asia, London & NY sessions mapped in real time, boxes, VWAP, kill zones, range extensions, and a built-in RSI panel.
Wskaźnik
Prop
Forex
+5
ATR Ratio SuperTrend show Trend & volatility combined. Clean arrows, built-in Take Profit.
Wskaźnik
Key Levels
Supertrend
+3
Reversal Hunter by BeyondTrading — Stop guessing direction. Catch the turn before the crowd.

Możesz także polubić

Wskaźnik
VWAP
Volume
+2
Dynamic VWAP with ±1/±2 Standard Deviation Bands for intraday volatility, extremes and mean reversion.
Logo „ZigXRay”
Najwyżej oceniane
4.6
(5)
$29
/
$49
Wskaźnik
CHOCH
Key Levels
+5
ZigZag Market Structure Identifier - Multi-Layer Scanner: Convergent Pivot Detection, 4-TF Overlay & Naked Chart Mode.
Wskaźnik
Key Levels
Support & Resistance
Draws a colored High/Low/Open/Close box for any custom time range you set — trade breakouts & retests.
Wskaźnik
EMA
Supertrend
+4
Dynamic dual MA cloud indicator. Identifies trends, crossovers, and pullback entries in real time for any asset.
Wskaźnik
RSI
BTCUSD
+5
Identify market structure effortlessly with swing highs, lows, CHoCH, and BOS levels for smart trading decisions! 📊🔍"
Wskaźnik
Volume
Fixed Range Volume Profile
Wskaźnik
Key Levels
Support & Resistance
Clean psychological round-number grid with native pip and point auto-scaling across Forex, Gold, Indices, and Crypto.
Wskaźnik
BOS
MSS
+5
One indicator, full ICT/SMC picture — structure, OBs, FVGs, liquidity, Premium/Discount — with graded PRIME/SETUP signal
Wskaźnik
SMC
Forex
+5
Silver Bullet by LudwigICT
Wskaźnik
Forex
cTrader ZigZag Alerts: Precision Swing Detection, Alerts, and Fibonacci.
Wskaźnik
ATR
Channel
Reversal Trap Probability Bands plots a dynamic volatility envelope around price & automatically detects "trap" reversal
Wskaźnik
Signal
Stocks
+5
🚀 Automated Elliott Wave & Fibonacci tool for cTrader. Spot trends, corrections & retracements fast.
Wskaźnik
Forex
BTCUSD
+12
Pro Structure Patterns Detector
Wskaźnik
Forex
BTCUSD
+5
Buy-Side & Sell-Side Liquidity (BSL/SSL) Indicator
Wskaźnik
Detects Head & Shoulders patterns, plots signals, and alerts for trading opportunities.
Wskaźnik
Forex
Crypto
+4
Auto Trend Line Indicator for cTrader
Logo „MultiTimeFrameTrend”
Najwyżej oceniane
4.0
(4)
$19
/
$30
Wskaźnik
A compact, visual multi-timeframe trend indicator for cTrader. Easily spot bullish or bearish trends across 4 customizab
Wskaźnik
Prop
Forex
+14
Automatically plots Fibonacci retracement levels using the highest and lowest points of a customizable time range

Cena

Od 21/01/2026
4
Sprzedaż
214
Bezpłatne instalacje