
Descripción
El indicador se basa en analizar la acción del precio 📈 para identificar cambios en la estructura del mercado y áreas clave de interés. A continuación, se presenta un resumen detallado de cómo funciona:
Detección de Pivotes y Formación del Zigzag 🔄
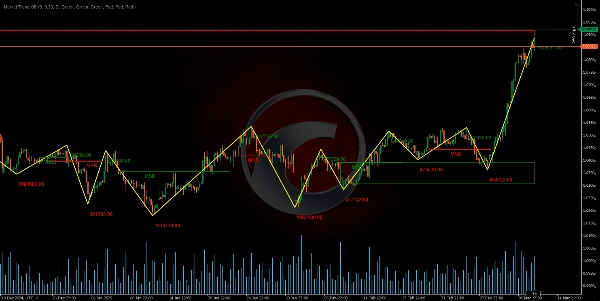
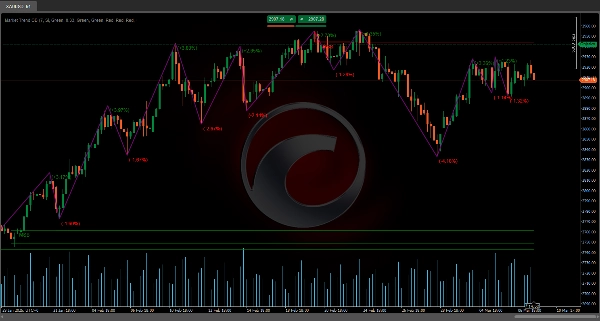
Se analiza un período específico (definido por un parámetro de longitud) para identificar máximos y mínimos relativos. Al comparar los precios dentro de ese intervalo, se detectan puntos pivote (puntos de inflexión), que, a su vez, forman el patrón zigzag ⚡. Este patrón ayuda a distinguir cuándo ocurre un reverso de precio.
Acumulación de Volumen y Cálculo de la Desviación 📊
Durante el proceso de detección de pivotes, se acumula el volumen tick en el segmento evaluado. Además, se calcula la diferencia porcentual entre los precios pivote para determinar si el movimiento es lo suficientemente significativo. Esta desviación se compara con un umbral definido, lo que ayuda a confirmar que el cambio en la estructura es real ✅.
Definición de la Ruptura de la Estructura del Mercado (MSB) 🚨
El indicador evalúa los dos últimos pivotes (ya sean máximos o mínimos) y, aplicando un factor de retroceso (inspirado en los niveles de Fibonacci), determina si ha ocurrido una ruptura en la estructura.
- Si, después de romper un máximo anterior, el precio comienza a generar mínimos más bajos, se identifica un cambio hacia una estructura bajista 🐻.
- De manera similar, si después de romper un mínimo anterior, el precio genera máximos más altos, se asume una transición a una estructura alcista 🐂.
Este cambio se interpreta como una Ruptura de la Estructura del Mercado (MSB).
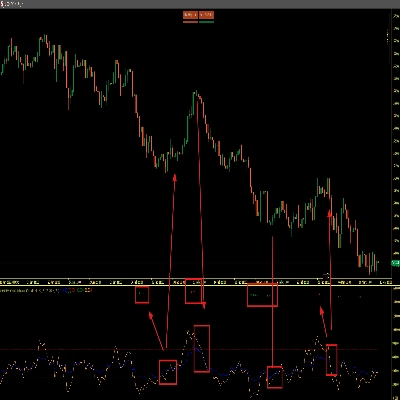
Identificación de Bloques de Orden y Cajas de Ruptura 📦
Una vez detectado un MSB, se definen zonas críticas basadas en la acción previa del precio:
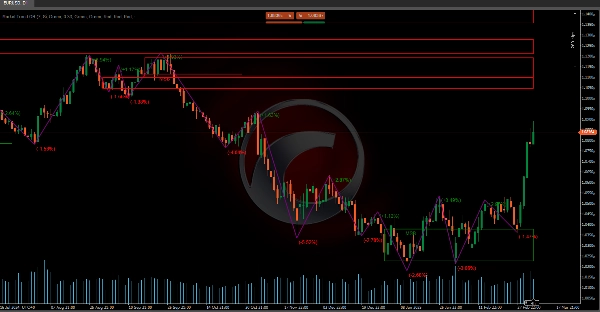
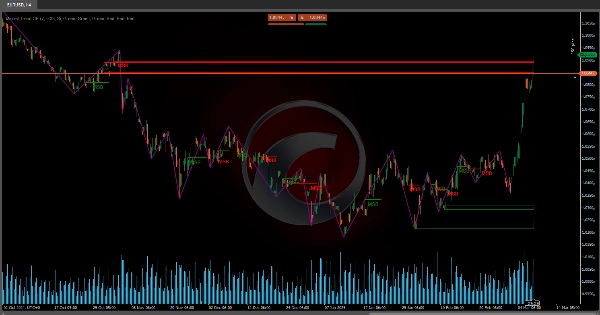
- Bloques de Orden (OB) 🧱: Estos se identifican como zonas donde ocurrió la última acción significativa antes de la ruptura. En una estructura bajista, se toma la última vela alcista antes del nuevo máximo; en una estructura alcista, se usa la última vela bajista antes del nuevo mínimo.
- Cajas de Ruptura (BB) 📈: Estas se determinan de manera similar pero consideran un rango adicional para confirmar que el precio rompió el nivel previo.
Estas zonas ayudan a definir áreas donde la actividad está concentrada y pueden actuar como soporte o resistencia en el futuro.
Visualización de Datos Relevantes del Zigzag 📊
Además de trazar la secuencia de pivotes, el indicador incorpora datos adicionales:
- Precio de Reversión 💹: Se registra el valor exacto donde se detecta el cambio de tendencia.
- Cambio Porcentual de Reversión 🔄: Se calcula la variación porcentual entre el nuevo precio pivote y el anterior, indicando la magnitud del cambio.
- Volumen Acumulado 📉: Se muestra la suma del volumen tick durante el segmento que conduce a la formación del pivote.
Estos datos permiten evaluar la fuerza y relevancia del movimiento sin basarse en suposiciones, ya que se fundamentan en cálculos concretos.
En resumen, la herramienta analiza la acción del precio para detectar cuándo el mercado cambia de tendencia (MSB) y define zonas (bloques de orden y cajas de ruptura) que pueden ser clave para decisiones de trading 💼. La integración del patrón zigzag con análisis de volumen y desviaciones porcentuales ofrece una visión completa de la estructura del mercado, proporcionando información precisa sobre puntos de reversión y la fuerza del movimiento 💪.
Indicadores de Ctrader Store:
Dynamic Market Structure
Analysis of Turning Points
Fibonacci Linear
Regression Multi-timeframe
Multi-Level Candle Bias
Tracker
Auto Support and
Resistance Trend Lines
Resumen
It defines Market Structure Breaks (MSB) by evaluating recent pivots with a retracement factor inspired by Fibonacci levels. A break in structure is signaled when price action shifts from higher highs to lower lows (bearish) or from lower lows to higher highs (bullish).
Upon detecting an MSB, the indicator identifies critical zones: Order Blocks (OB), representing the last significant candle before a breakout, and Breakout Boxes (BB), which confirm price level breaches with an additional range. These zones serve as potential future support or resistance areas.
The tool visualizes relevant zigzag data, including reversal prices, percentage changes, and accumulated volume, enabling assessment of movement strength and relevance based on concrete calculations. This comprehensive approach integrates zigzag patterns, volume analysis, and deviation metrics to provide precise information on reversal points and market movement strength, supporting informed trading decisions.
Valoraciones de clientes
5 | 100 % | |
4 | 0 % | |
3 | 0 % | |
2 | 0 % | |
1 | 0 % |


![Logotipo de "[Hamster-Coder] Bollinger Bands"](https://cdn.ctrader.com/image/webp/21d8e5d6-fb11-4bac-b9ee-cd05c2b76804_30327)


![Logotipo de "[Hamster-Coder] Moving Average MTF"](https://cdn.ctrader.com/image/webp/b11b98b1-194d-4b8e-b00e-d611826ad159_31226)

