present
Inscrivez-vous et bénéficiez d'une remise de 50 $ sur votre premier achat
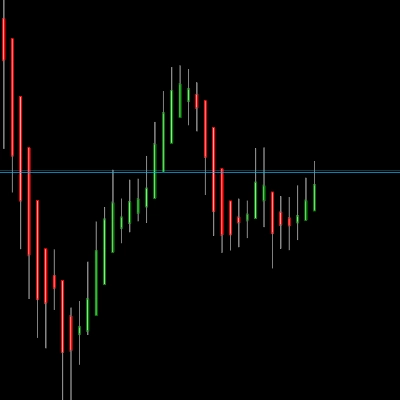
Trading product for Correlation Meter Indicateur Premium/Discount  RSI, image 1
Correlation Meter
Indicateur
Version 1.0, Apr 2026
Windows, Mac
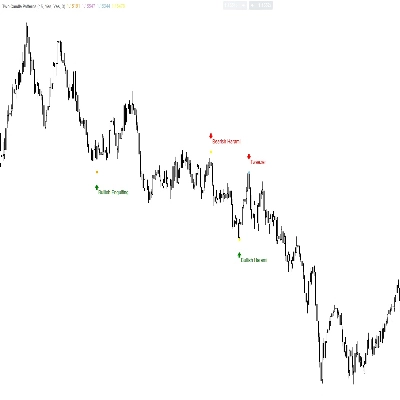
Trading product for Correlation Meter Indicateur Premium/Discount  RSI, image 2
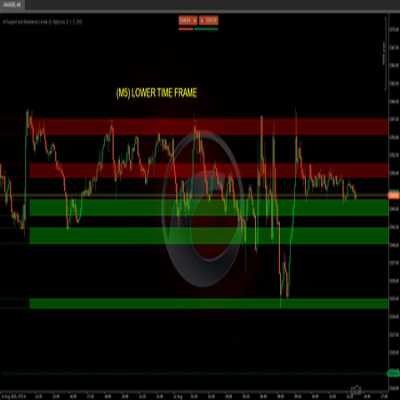
Trading product for Correlation Meter Indicateur Premium/Discount  RSI, image 3
12.28M
Volume tradé
31.27K
Pips gagnés

Description

Track correlation divergences before the market corrects.

Most traders know that XAUUSD and DXY move inversely. Or that XAUUSD and XAGUSD tend to move together. What they don't have is a tool that tells them when that relationship breaks down and what to do about it.

Correlation Meter calculates a live Pearson correlation coefficient between any two symbols using log-returns (the statistically correct input for financial data). It then compares that short-term reading against a longer historical average and fires an alert the moment the gap becomes significant.

How it works

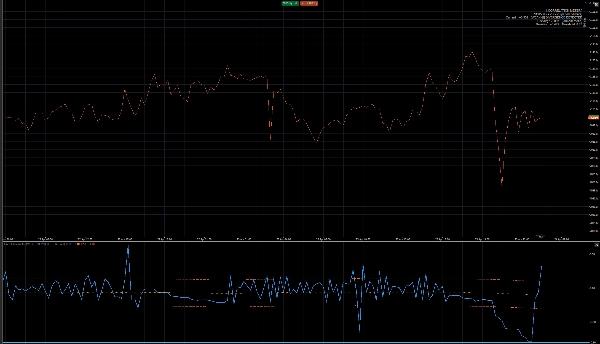
The indicator opens in a sub-window below your chart, similar to RSI. A blue line shows the current 50-bar correlation. An orange dotted line shows the 200-bar historical average. Two red bands mark the divergence threshold. When the blue line breaks outside those bands, the correlation between your two symbols has shifted beyond its normal range meaning one symbol has lagged behind the other and a statistical reversion is probable.

A colour-coded overlay panel in the corner of your chart shows correlation strength at a glance: from Very Strong (≥0.90) down to None (<0.30).

Risk warning

If you hold two highly correlated positions open at the same time. For example XAUUSD long and XAGUSD long with a +0.93 correlation the indicator flags a red warning that your actual risk exposure is nearly double what it appears. Two positions are not two separate bets if they move as one asset.

Pre-configured pairs

Works with any two symbols your broker offers. Suggested starting pairs: XAUUSD/DXY, XAUUSD/XAGUSD, USOIL/USDCAD, EURUSD/DXY, SPX500/VIX.

Parameters

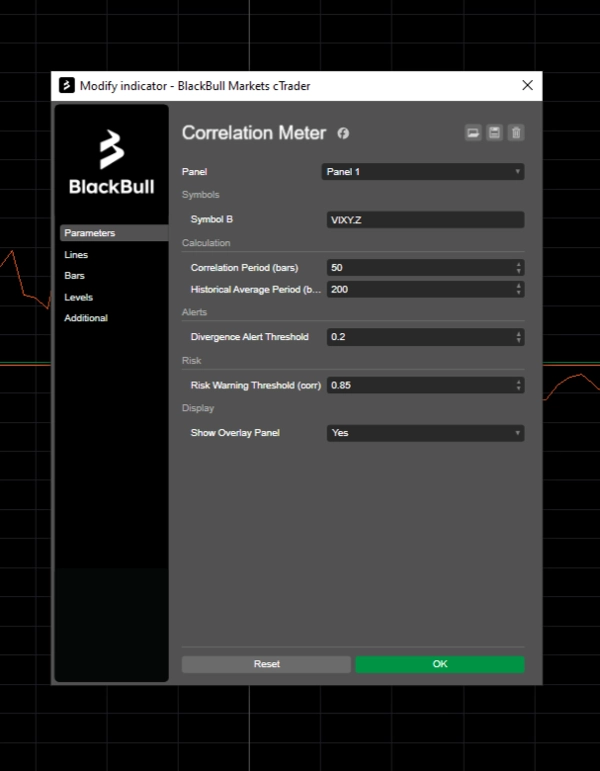
All key settings are adjustable: correlation period, historical average period, divergence threshold, and risk warning sensitivity. No coding required.
Résumé

Profil de l'indicateur
Catégorie de l'indicateur
Statistiques
Type de résultat
Signaux
Exigences en matière de données
Barres seulement
Signaux pris en charge
Divergence
Puissance de la tendance

Discussion

Avis clients

0.0
Avis : 0
Avis clients
Il n'y a pas encore d'avis sur ce produit. Vous l'avez déjà essayé ? Soyez le premier à en parler aux autres !

Questions fréquentes

Premium/Discount
RSI
Imbalance
Market Structure
Les produits disponibles sur cTrader Store, notamment les bots de trading, les indicateurs et les plug-ins, sont fournis par des développeurs tiers et mis à disposition à titre informatif et à des fins d'accès technique uniquement. cTrader Store n'est pas un courtier et ne fournit aucun conseil en investissement, aucune recommandation personnelle ni aucune garantie quant aux performances futures.

Plus de cet auteur

Indicateur
Prop
Forex
+11
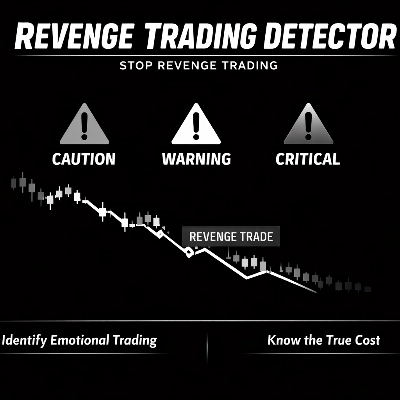
Detects revenge trades in real time and shows exactly how much they've cost you, before the next one makes it worse.

Vous pourriez aussi aimer

Indicateur
Indices
Multi-Timeframe ADX Trend Dots & Arrows
Indicateur
Prop
Forex
+12
⚡ ADXVMA Aurora Trend Filter combines ADX trend strength with an adaptive EMA blend ⚡
Indicateur
ADX
ATR
+2
GOLD SENTINEL v1.0 - A CANDLE-COLORING INDICATOR FOR GOLD.
Indicateur
Forex
BTCUSD
+10
Enhance trading with TSI! Use the True Strength Index for clear insights into market momentum and trend strength.
Indicateur
Prop
Forex
+13
🎯Automatically detects and visualizes classical chart patterns using multi-timeframe swing point analysis.
Indicateur
Doji
Volume
+5
Instantly spot high-liquidity institutional moves with clean, non-obtrusive triangle alerts on cTrader charts.
Logo de "RSI Advanced"
Les mieux notés
5.0
(4)
$20
/
$30
Indicateur
AI
ATR
+12
The standard Relative Strength Index (RSI), RSI & Signal Cloud, Smart Volatility Filter (ATR), On-Chart Info Dashboard
Indicateur
Prop
Forex
+4
The Smooth Heiken Ashi indicator is a refined charting tool designed to filter out market noise and highlight true price
Indicateur
ADX
ATR
+5
Configure, simulate, and analyze trading strategies with custom filters, multi-target exits, and detailed performance me
Logo de "VWAP_MTF"
Les mieux notés
4.5
(4)
$19
/
$30
Indicateur
SMC
Prop
+16
📊 VWAP with MTF & Dynamic Deviation Bands
Indicateur
MACD
Prop
+8
NTNPICLL is a tool to check the best trading hours for the assets and also includes the highest and lowest point
Indicateur
Forex
BTCUSD
+11
Auto-detects Bullish/Bearish Engulfing patterns to spot trend reversals. Real-time alerts, custom colors, all symbols.
Indicateur
ATR
BOS
+5
Opening ranges, dynamic trend channels, and multi-scale breakout/retest analysis for clear intraday chart decisions.
Indicateur
Forex
BTCUSD
+13
Sniper Zone Pro: High-precision institutional zones and candle strength for identifying key market tests.
Indicateur
AI
Grid
+17
Clean 3D, Sleek Candles for Trend Patterns.
Indicateur
Forex
Crypto
+3
Detect powerful 2-candle reversal patterns at key highs/lows. Boost entries with real-time alerts and visual signals.
Indicateur
RSI
Breakout
+1
"Identify key market zones and visualize support/resistance from multiple timeframes on a single chart.
Indicateur
Advanced price action tool that combines multiple technical analysis concepts

Prix

12.28M
Volume tradé
31.27K
Pips gagnés