

Opis
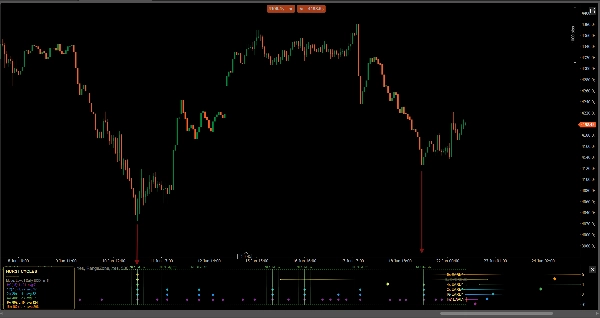
MTC Hurst Cycle Akademica mapuje cykliczną strukturę każdego rynku, poziom po poziomie, w dedykowanym podoknie. Oparta na cyklicznym modelu rynku J. M. Hursta, oznacza potwierdzone dołki cykli (a opcjonalnie także szczyty) każdego włączonego poziomu cyklu jako kolorowe diamenty, prognozuje czas następnego spodziewanego dołka cyklu i podkreśla "Gniazdo Dołków" — świece, na których spodziewane jest zbieganie się kilku dołków cykli, klasyczny kontekst wysokiego prawdopodobieństwa zwrotu według Hursta.
KLUCZOWE CECHY
• 7 zagnieżdżonych poziomów cykli (HC, 1C, 2x, 4x, 8x, 16x, 32x) — włącz dowolną kombinację.
• Diamenty tylko potwierdzone — najnowsze znaczniki NIE są przerysowywane na świecy na żywo.
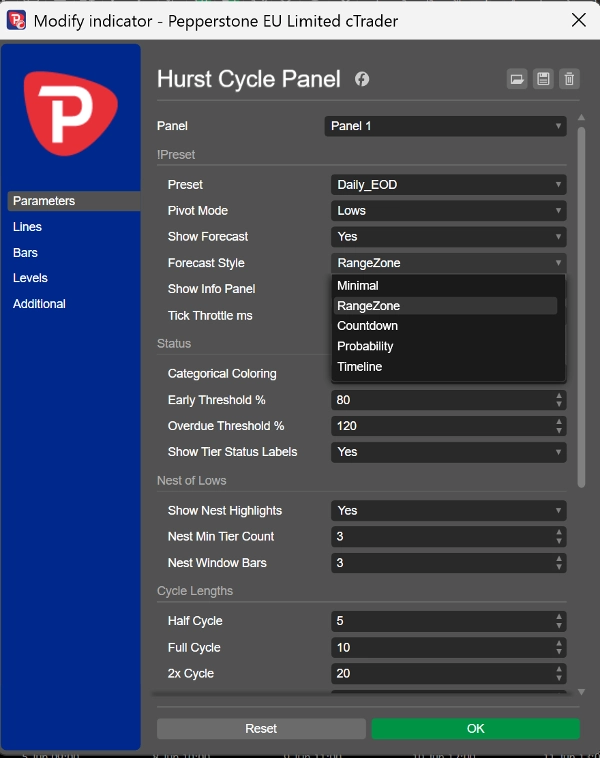
• Prognoza następnego dołka w 5 stylach wyświetlania: Minimalny, Strefa Zakresu, Odliczanie, Prawdopodobieństwo (1σ / 2σ), Oś Czasu.
• Podświetlenie "Gniazda Dołków", skalowane automatycznie do włączonych długości cykli.
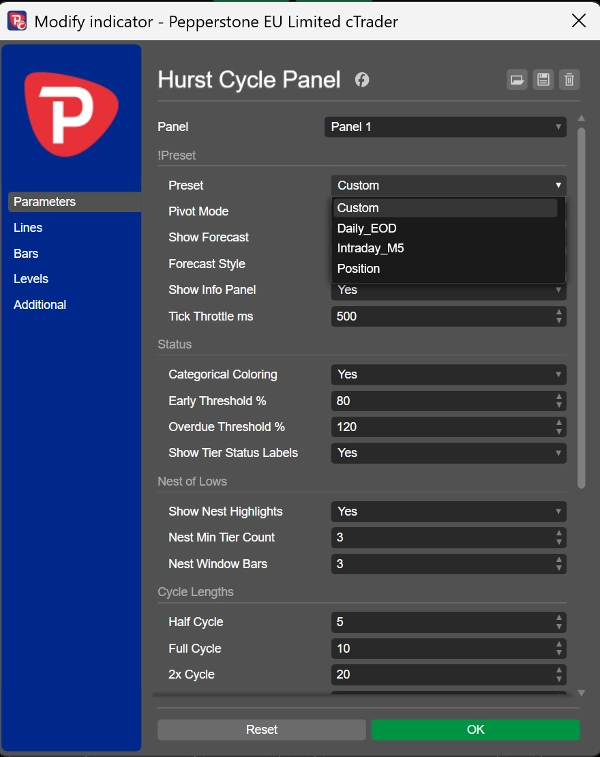
• Presety jednym kliknięciem: Dzienny EOD, Intraday M5, Pozycja — lub w pełni niestandardowe długości cykli.
• Nowoczesny panel informacyjny na wykresie: liczba pivotów na poziom, zmierzona średnia długość cyklu (pokazywana tylko gdy statystycznie istotna) oraz kontrola harmonicznego stosunku.
• Tryb pivotów: Dołki, Szczyty lub oba.
• Automatyczne dopasowanie skali, czyste i pozbawione migotania renderowanie.
JAK UŻYWAĆ
Dodaj go poniżej wykresu cenowego. Odczytuj najniższe diamenty i podświetlenie "Gniazda" jako podstawę czasową cyklu rynku i używaj prognozy, aby przewidzieć okno czasowe następnego zwrotu. Naturalnie łączy się z MTC Hurst FLD Akademica (poziomy cenowe) oraz MTC Hurst Pulse Akademica (oscylator dojrzałości cyklu).
DZIAŁA NA
Dowolnym symbolu i dowolnym interwale czasowym.
ZASTRZEŻENIE
To narzędzie do analizy technicznej i wizualizacji oparte na teorii cyklicznego rynku J. M. Hursta. Nie składa zleceń i nie gwarantuje wyników, dokładności ani zysków. Analiza cykli jest probabilistyczna, a prognozy są szacunkami, nie przewidywaniami. Zawsze stosuj własne zarządzanie ryzykiem i ocenę. Przeszłe zachowanie rynku nie gwarantuje przyszłych rezultatów.
Podsumowanie
Key features include seven nested cycle tiers (HC, 1C, 2x, 4x, 8x, 16x, 32x) with customizable combinations, one-click presets for common timeframes (Daily EOD, Intraday M5, Position), and a modern on-chart info panel showing pivot counts, average cycle length, and harmonic-ratio checks. Users can select pivot modes (Lows, Highs, or Both) and benefit from auto-fitting scale and flicker-free rendering.
The panel works on any symbol and timeframe and is intended as a visualization tool to aid cycle timing analysis. It complements other Hurst-based tools for price levels and cycle maturity oscillation.


















![Logo „[CB] Pivot Points Pro”](https://cdn.ctrader.com/image/webp/43463c82-67b0-4f10-a4ba-901bba091d81_32594)
