Açıklama
MTC INTERACTIV RAINBOW PRO
BU GÖKKUŞAĞI NEDEN FARKLI
Gökkuşağı göstergeleri yıllardır var, grafikte hareketli ortalamaların güzel bantları. Sorun şu ki: neredeyse hiç kimse onları nasıl okuyacağını veya karar haline nasıl getireceğini bilmiyor. Harika görünüyorlar… ve sonra kullanılmadan kalıyorlar.
MTC Interactiv Rainbow Pro tam olarak bunu, etkileşimli olarak çözüyor. Onlarca renkli çizgiye bakıp tahmin etmek yerine, gökkuşağı ile BİRLİKTE çalışıyorsunuz: üzerine gelin, tıklayın, odaklanın, ölçün ve grafiğin kendini açıklamasına izin verin.
GÖRDÜKLERİNİZ
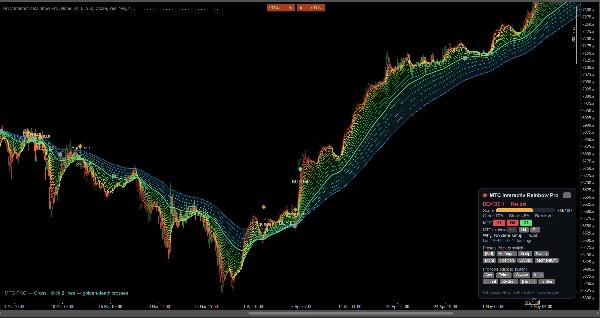
• Trend yönünü, gücünü ve momentumu tek bakışta gösteren yoğun, düzgün bir EMA gökkuşağı.
• Kapalı barlarda, yeniden boyanmayan net AL / SAT / ÇIKIŞ işaretçileri ve sıkışma/kırılma bölgeleri.
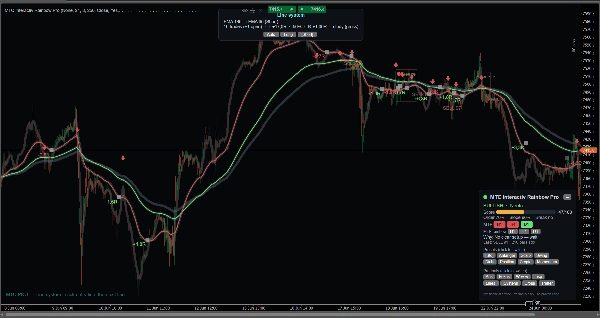
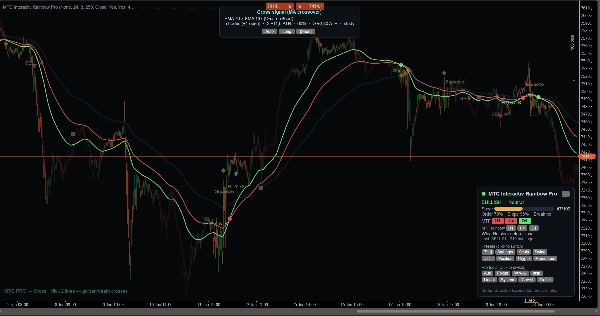
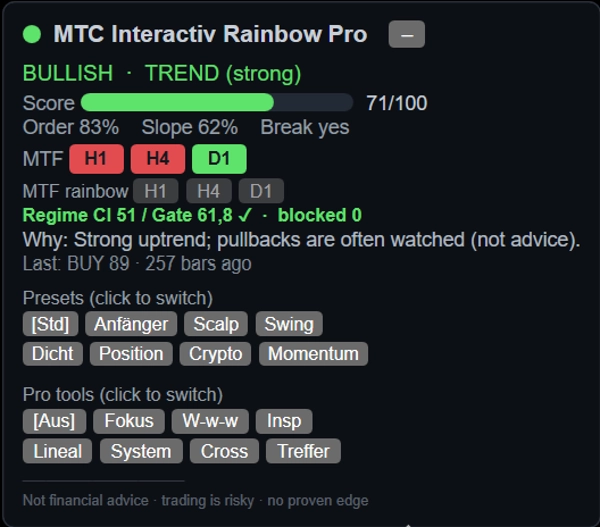
• Kompakt bir canlı gösterge paneli: yön, 0–100 güç puanı, emir/eğim/kırılma okumaları, çok zaman dilimli fikir birliği ve sade dilde "neden".
ETKİLEŞİMLİ OLAN (başkalarının vermediği kısım) NEDİR
• Herhangi bir çizginin üzerine gelerek anında EMA periyodunu görün — sonunda hangi ortalamaya baktığınızı bilin.
• Tek bir çizgiye odaklanın ve temiz bir görünüm için diğerlerini soluklaştırın.
• Herhangi bir barı veya geçmiş sinyali incelemek için "Ya şöyle olursa" ve İnceleme araçları.
• Dahili Cetvel (ATR / R / pip).
• İki ortalamanın nasıl etkileştiğini keşfetmek için Çizgi-Sistem ve Çapraz çalışmalar.
• Saygı oranı çalışması: fiyatın seçilen çizgiye ne sıklıkla saygı gösterdiği.
• Tek tıklamayla MTF Gökkuşağı üst üste bindirme: mevcut grafiğinizde gri renkte H1 / H4 / D1 gökkuşağını görün.
• 8 tek tıklamalı ön ayar (Yeni başlayan, Scalping, Swing, Pozisyon, Kripto, Momentum, Yoğun, Standart).
• İsteğe bağlı rejim filtresi ve disiplinli risk düşüncesi için ticaret yönetimi üst üste bindirmesi (yapılandırma durdurma, 1R risk bandı, takip eden çizgi).
NASIL OKUNUR
Yelpazelenmiş ve sıralanmış = güçlü trend. Bir araya sıkışmış = sarma, bir kırılma yakın. Yukarı/aşağı ok = kırılma sinyali. Bant ne kadar yoğun ve düzenliyse, hareket o kadar güçlüdür. Dahili etkileşimli bir eğitim (İngilizce ve Almanca) sizi adım adım yönlendirir.
KİMLER İÇİN
• Her zaman bir gökkuşağı kullanmak isteyen ama nasıl yapacağını bilmeyen yeni başlayanlar — etkileşimli araçlar size kullanırken öğretir.
• Trend, momentum ve çok zaman dilimli bağlamın hızlı, temiz okunmasını isteyen deneyimli traderlar.
• Bot geliştiriciler: kendi EMA / MA stratejileriniz ve botlarınız için şeffaf bir araştırma temeli.
Her sembol ve zaman diliminde çalışır; etkileşimli araçlar M5–H4 aralığında parlıyor. Minimum hesap büyüklüğü yok — bu bir analiz aracıdır, otomatik işlemci değildir.
ÖNEMLİ — LÜTFEN OKUYUN
Bu bir analiz ve öğrenme aracıdır, yatırım tavsiyesi veya kâr garantisi değildir. Tüm sinyaller, puanlar ve simüle edilmiş işlemler gözlemlerdir, istatistiksel olarak kanıtlanmış bir avantaj değildir. Kaldıraçlı işlem risklidir ve tam kayba yol açabilir. Her zaman kendi kararlarınızı verin ve önce demo hesapta test edin.
Özet
Key features include an interactive interface allowing users to hover over lines to identify EMA periods, focus on individual lines, and use tools like "What-if" analysis, inspection of past signals, and a built-in ruler measuring ATR, price range, and pips. The indicator offers line-system and cross studies to analyze interactions between averages, a respect-rate study to assess price adherence to specific lines, and a one-click multi-timeframe rainbow overlay showing higher timeframe EMAs in grey.
A compact live dashboard provides a 0–100 strength score, order, slope, breakout readings, multi-timeframe consensus, and plain-language explanations. Eight one-click presets cater to various trading styles and markets, including scalp, swing, position, crypto, and momentum trading. Additional features include an optional regime filter and trade-management overlays for risk control.
Suitable for all symbols and timeframes, especially effective on M5 to H4 charts, this tool supports traders ranging from beginners learning to use EMA rainbows to experienced traders and bot developers seeking a transparent EMA research base.