present
Zarejestruj się i otrzymaj 50 $ zniżki na pierwszy zakup
Trading product for HCapitalFisherTransform Wskaźnik Market Structure Supply & Demand, image 1
HCapitalFisherTransform
Wskaźnik
1 pobrania
Wersja 1.0, Aug 2026
Windows, Mac
Trading product for HCapitalFisherTransform Wskaźnik Market Structure Supply & Demand, image 2
Trading product for HCapitalFisherTransform Wskaźnik Market Structure Supply & Demand, image 3
Trading product for HCapitalFisherTransform Wskaźnik Market Structure Supply & Demand, image 4
Od 09/03/2026
3.06M
Wolumen transakcji
253.65K
Zysk w pipsach
296
Bezpłatne instalacje

Opis

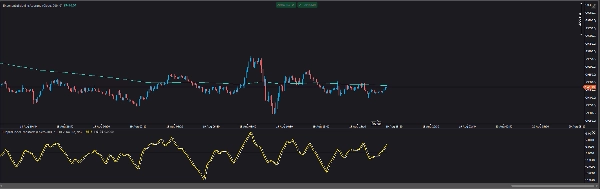
H Capital Fisher Transform is a free cTrader implementation of the Fisher Transform developed by John F. Ehlers.

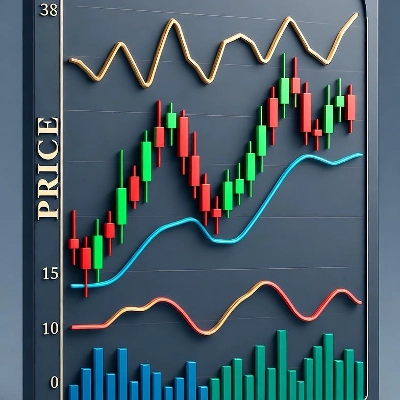
The indicator measures where price is positioned within its recent range, then applies the Fisher mathematical transformation to amplify values near the upper and lower extremes. This produces the sharp peaks and troughs for which the Fisher Transform is known and can make changes in short-term market direction easier to visualize.

This version was built with an emphasis on formula accuracy, transparency, and simplicity rather than adding unnecessary features or promising unrealistic trading results.

Included

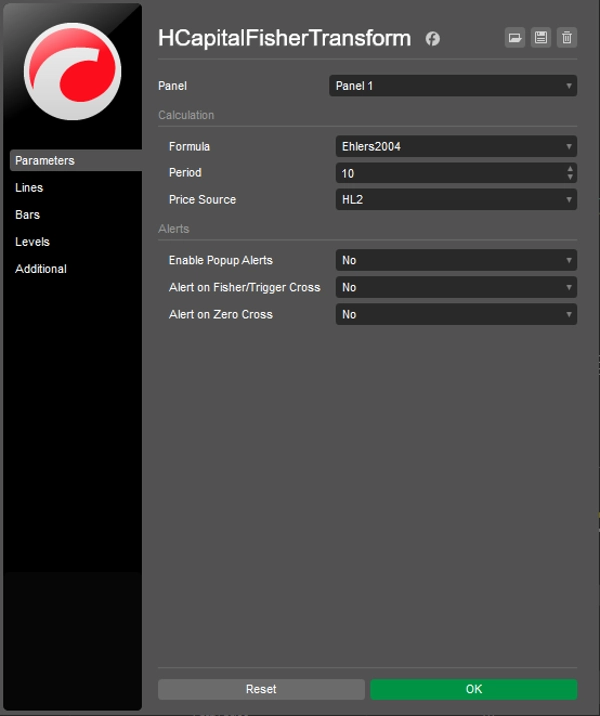
  • Ehlers 2004 Formula — the later formulation used as the default.
  • Ehlers 2002 Formula — the original published version available as an optional mode.
  • Adjustable lookback period.
  • Multiple price-source options.
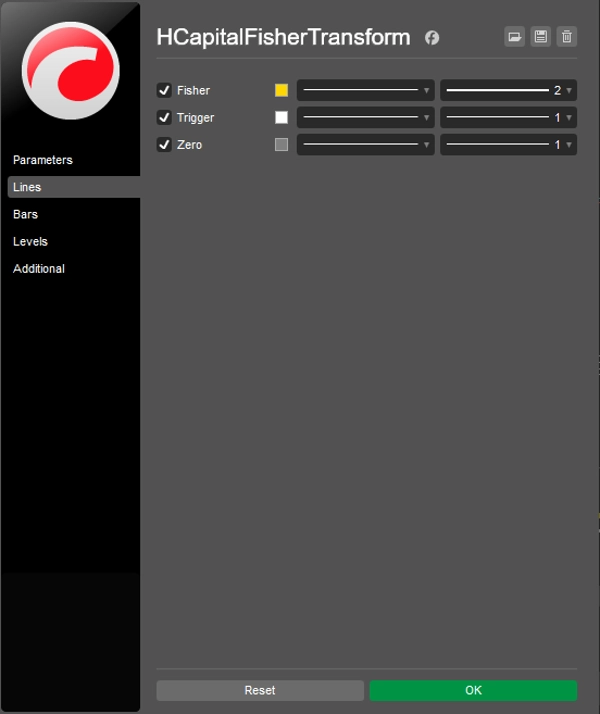
  • Fisher line.
  • Trigger line.
  • Zero reference line.
  • Optional Fisher/Trigger crossover alerts.
  • Optional zero-cross alerts.
  • Alerts based on confirmed closed bars.
  • Public output series for future cBot or indicator integration.
  • No future-bar calculations or look-ahead logic.

How to read it

A rising Fisher value indicates that price is moving toward the upper portion of its recent range.

A falling Fisher value indicates that price is moving toward the lower portion of its recent range.

The Trigger is the previous Fisher value. A crossover therefore highlights a change in the short-term direction of the Fisher line.

Large positive or negative readings show that price is near an extreme of its recent range. They should not automatically be interpreted as buy or sell signals.

A strong trend can keep Fisher at an extreme for an extended period, and the indicator can produce false turns during trending or choppy market conditions.

For that reason, Fisher is generally more useful as a market-analysis and confirmation tool than as a standalone trading system.

H Capital approach

This indicator is part of the H Capital project to research established trading indicators, understand the mathematics and evidence behind them, rebuild useful tools for cTrader, and make them freely available.

No claimed win rates.
No hidden logic.
No paywall.

Research it. Build it. Test it. Share it.

This indicator is provided for research and educational purposes and does not guarantee profitable trading results.

Podsumowanie

Profil wskaźnika
Kategoria wskaźnika
Dynamika
Typ wyjścia
Wizualizacja
Sygnały
Wymagania dotyczące danych
Tylko słupki
Obsługiwane sygnały
Siła trendu

Opinie klientów

0.0
Opinie: 0
Opinie klientów
Ten produkt nie ma jeszcze opinii. Wypróbowałeś(-aś) go już? Bądź pierwszy(-a) i powiedz o tym innym!

Dyskusja

Częste pytania

Market Structure
Supply & Demand
Liquidity Grab
Produkty dostępne za pośrednictwem cTrader Store, w tym boty handlowe, wskaźniki i wtyczki, dostarczane są przez deweloperów zewnętrznych i udostępniane wyłącznie w celach informacyjnych oraz w celu zapewnienia dostępu technicznego. cTrader Store nie jest brokerem i nie zapewnia doradztwa inwestycyjnego, nie udziela spersonalizowanych rekomendacji ani nie gwarantuje przyszłych wyników.

Więcej od tego autora

Wskaźnik
Grid
Prop
+4
A free institutional-style chart tool that maps key daily liquidity levels in a clean H Capital interface.
cBot
Prop Firm Fit
One-click Trading
+3
Watches your equity in real time and blocks new trades the moment you're near your daily or max loss limit.

Możesz także polubić

Wskaźnik
EMA
RSI
+5
Keep your focus with smart on-chart notes. Features Markdown, 6 themes, and auto-save per symbol for manual trading.When
Wskaźnik
Prop
Forex
+14
🚀See the market’s framework, decide faster. Session-Aware Pivots. Auto Presets. Pro-Grade Zones.🚀
Wskaźnik
RSI
SMC
+3
High Low Divergence is a clean, overlay indicator that automatically identifies swing highs and swing lows
Wskaźnik
Prop
Forex
+6
The Parabolic SAR, or "Stop and Reverse," is a dynamic technical analysis tool.
Wskaźnik
Forex
Alerts you when price touches Fibonacci levels. Stay organized and trade efficiently!
Logo „Zigzag Trend”
Najwyżej oceniane
4.5
(4)
$25
/
$45
Wskaźnik
AI
ATR
+23
The ZigZag Trend is a market structure tool that filters out small price fluctuations and highlights major swing.
Wskaźnik
AI
ATR
+26
Liquidity Cluster Order automatically detects and draws accumulation zones & distribution zones
Wskaźnik
ATR
MSS
+5
Grades ICT Unicorn setups (Breaker Block + FVG confluence) into PRIME / SETUP / WATCH, with retest & RR targets.
Wskaźnik
BOS
Volume
+5
20/40/60-day IPDA lookback ranges, Premium/Discount/Equilibrium zones, and quarterly shift alerts — anchored to true dai
Wskaźnik
ATR
Key Levels
+1
See both sides of the trade before you take either one.
Logo „Oscillator Scanner”
Najwyżej oceniane
4.7
(4)
$20
/
$39
Wskaźnik
ATR
RSI
+7
Track the Movement of Market Assets with an Oscillator Scanner in Real-Time!
Wskaźnik
SMC
Forex
+5
Pinpoint FVGs, track fills and see mitigation stats — trade imbalances with clarity and confidence.
Wskaźnik
Displays the previous day's, last week's, and last month's highest and lowest price levels on your chart.
Wskaźnik
Forex
EURUSD
+5
Smart Money Breakout Channels – Auto-detect breakout zones with price, volume & volatility insights on cTrader.
Wskaźnik
Forex
⏱ Candle Time Remaining – Real-Time Candle Countdown Indicator
Wskaźnik
Smart Signal Reversal Trend + Patterns
Wskaźnik
XAUUSD
Professional Volume Profile Indicator - Shows volume distribution, POC, Value Areas & Buy/Sell pressure.
Wskaźnik
Forex
BTCUSD
+10
Trend-following channel using dual MAs with visual cloud and optional alerts on crossovers

Cena

Od 09/03/2026
3.06M
Wolumen transakcji
253.65K
Zysk w pipsach
296
Bezpłatne instalacje