present
Zarejestruj się i otrzymaj 50 $ zniżki na pierwszy zakup
Od 13/02/2025

Opis

Podsumowanie

Podsumowanie AI
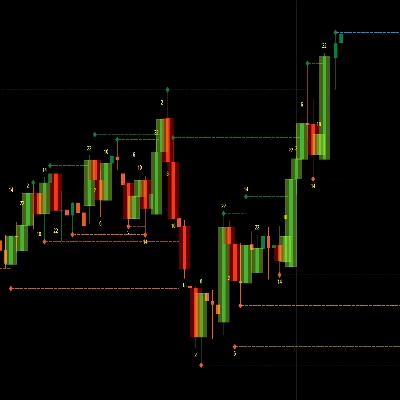
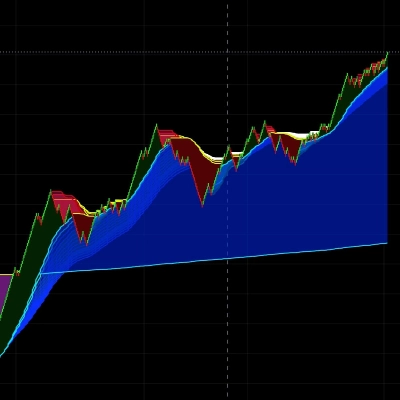
Sample EMA is an indicator for the cTrader (cAlgo) platform that combines the SuperTrend and Moving Average (MA) concepts into a single tool called SuperTrendMA. It calculates a user-selectable type of moving average (default is Exponential) over a specified period (MA Length). It also computes the Average True Range (ATR) over a defined ATR Period and applies an ATR Multiplier to generate SuperTrend bands. Market trends are identified based on price position relative to these bands: an uptrend is signaled when the price closes above the DownTrend Band, and a downtrend when it closes below the UpTrend Band. The indicator visually represents trends with colored lines—lime for uptrend and red for downtrend—and provides trade entry signals using arrows: green arrows indicate a shift from downtrend to uptrend (buy signal), and red arrows indicate a shift from uptrend to downtrend (sell signal). This indicator supports trend analysis and trade signal generation by integrating volatility and moving average data.
Profil wskaźnika

Dyskusja

Opinie klientów

0.0
Opinie: 0
Opinie klientów
Ten produkt nie ma jeszcze opinii. Wypróbowałeś(-aś) go już? Bądź pierwszy(-a) i powiedz o tym innym!

Częste pytania

Supertrend
ATR
Produkty dostępne za pośrednictwem cTrader Store, w tym boty handlowe, wskaźniki i wtyczki, dostarczane są przez deweloperów zewnętrznych i udostępniane wyłącznie w celach informacyjnych oraz w celu zapewnienia dostępu technicznego. cTrader Store nie jest brokerem i nie zapewnia doradztwa inwestycyjnego, nie udziela spersonalizowanych rekomendacji ani nie gwarantuje przyszłych wyników.

Możesz także polubić

Wskaźnik
Spot Strong Trends Early & Filter Market Noise
Wskaźnik
ATR
Scalping
+1
Auto Fibonacci Retracement Pro – Smart Swing & Golden Zone Levels
Wskaźnik
Volume
Key Levels
Interactive tick-volume profile with a draggable range box, sculpted histogram, and POC, VAH and VAL levels.
Wskaźnik
VWAP
Volume
+1
FW Next Level: Rolling VWAP for 7, 30, 90 and 365 days plus daily VWAP with SD bands and price zones.
Wskaźnik
Forex
Customizable multi-timeframe pivot point indicator for cTrader with alerts, Fibonacci, CPR, and more!
Wskaźnik
BOS
CHOCH
+3
Smart Money Concepts Pro v5.1 for cTrader is a structural market analysis indicator that identifies swings, BOS, CHoC
Wskaźnik
Parabolic SAR Alert - Trend reversal alerts with smart signals & custom alerts.
Wskaźnik
ATR
EMA
+3
High-Tech 3-Level Squeeze Detection with HTF Filter, Carter Entry/Exit Rules, Signal Quality Grading & Real-Time
Wskaźnik
BOS
MSS
+5
Zone indicator for gold, forex, crypto and indices: H4/H1 forts, M30 kill zones, swing objectives and a strike plan.
Wskaźnik
RSI
Signal
+2
Dynamic circles visualize price's volatility position. Like RSI for market overextension & stretch. Quantify context.
Wskaźnik
Key Levels
Liquidity Grab
+1
Visualize Asia, London and New York sessions with range boxes, opening levels, prior-day highs/lows and sweep markers.
Wskaźnik
ADX
CCI
+5
One momentum score from RSI, Stoch, CCI, MACD, ROC and MFI, with filtered signals, ATR levels, alerts and a webhook
Wskaźnik
Forex
BTCUSD
+5
Buy-Side & Sell-Side Liquidity (BSL/SSL) Indicator
Wskaźnik
VWAP
Volume
+5
The MA Quant Volume Profile Custom Range is a trading indicator that analyzes volume distribution across the price.
Wskaźnik
MACD
Prop
+8
NTNPICLL is a tool to check the best trading hours for the assets and also includes the highest and lowest point
Wskaźnik
RSI
MACD
This indicator is a combination of MACD and RSI into one. This is perfect fusion and powerful indicator ever.
Wskaźnik
Laser entries with pivot confirmation. No repaint, all timeframes. Professional results.
Wskaźnik
Prop
Forex
+7
The Parabolic SAR, or "Stop and Reverse," is a dynamic technical analysis tool.

Cena

Od 13/02/2025