
present
Sign up and get $50 off your first purchase
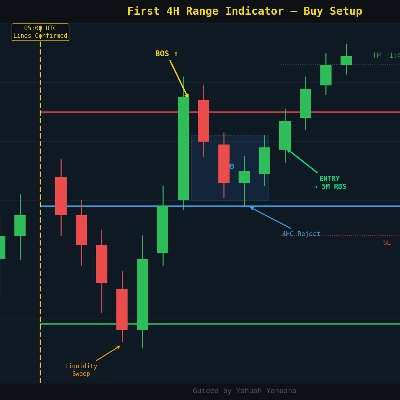
Trading product for first 4h candle of the day guide yahuah yahusha Indicator Key Levels BOS, image 1
first 4h candle of the day guide yahuah yahusha
Indicator
Version 1.0, Sep 2026
Windows, Mac
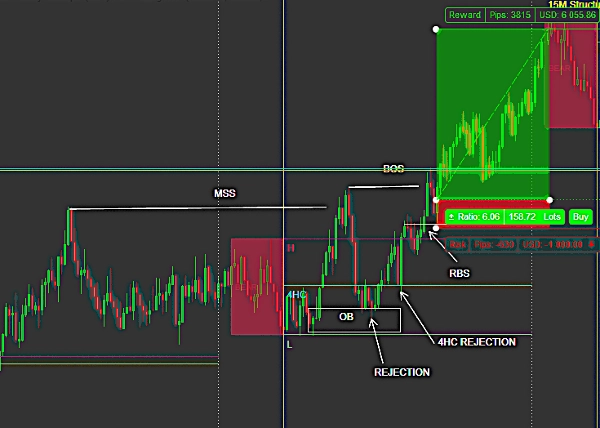
Trading product for first 4h candle of the day guide yahuah yahusha Indicator Key Levels BOS, image 2
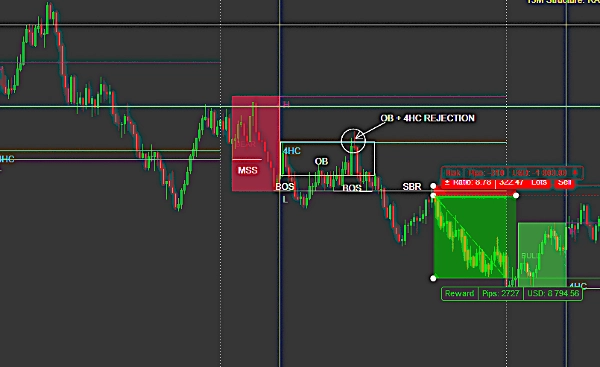
Trading product for first 4h candle of the day guide yahuah yahusha Indicator Key Levels BOS, image 3
1
Sales

Description

This indicator analyses the first 4-hour candle of each trading day to establish a daily price range. It identifies the high, low, and the close of the preceding 4H candle β€” three key levels that institutional traders and algorithms reference heavily at the start of each session. It also analyses 15-minute swing structure to determine the current market bias. this indicator can be used on any market prefer indices.


How to interpret signals and visual elements

  • Red horizontal line β€” the high of the first 4H candle. Acts as the upper boundary of the daily range and a potential resistance level
  • Green horizontal line β€” the low of the first 4H candle. Acts as the lower boundary and potential support
  • Blue horizontal line (4HC) β€” the close of the previous 4H candle, marking where price stood at the start of the new day. Often acts as a mid-range liquidity level
  • Gold vertical line β€” marks the exact bar where all levels were confirmed, making it easy to see when the range was set
  • 15M Structure panel β€” displays Bullish, Bearish, or Ranging bias based on recent swing highs and lows, with HH/HL/LH/LL labels plotted on the chart

All lines appear solid and locked the moment the first 4H candle closes. Nothing repaints or moves after confirmation.


Key settings and parameters

  • Max History Days β€” controls how many past days of levels are displayed
  • Show 4H Close at Day Open β€” toggles the blue 4HC line on/off
  • Show Day-Start Gold Line β€” toggles the gold vertical line
  • Show Vertical Markers β€” bounded tick marks at the range boundaries for visual reference
  • 15M Structure Bias β€” toggle swing labels and bias panel (5M chart only)
  • Swing Lookback / Swing Count β€” controls sensitivity of structure detection
  • Full color, thickness, and line style customisation for every element


Typical use cases and trading scenarios

  • Using the H and L as a daily range to look for reversals or breakouts during killzones (London/NY open)
  • Using the 4HC level as a mid-range target or confluence entry level
  • Combining the range with SMC, ICT, or CRT frameworks for high-probability setups
  • Checking the 15M bias panel before taking a 5M entry to ensure structural alignment


Who this indicator is best suited for

Intermediate to advanced intraday traders who use the daily opening range as a structural reference. Particularly suited to traders using Smart Money Concepts (SMC), ICT, or similar methodologies. Works across all timeframes but pairs best with 5M or 1M for entry precision.


Important limitations and usage notes

  • Levels only appear after the first 4H candle of the day closes β€” no levels are shown while that candle is still forming
  • The exact time levels appear depends on your broker's 4H candle alignment. On Deriv, the first 4H candle opens at 01:00 UTC and closes at 05:00 UTC
  • The 15M structure bias panel is restricted to the 5M chart only
  • For best scroll performance, disable the gold vertical line or reduce Max History Days if experiencing lag


Summary

AI summary
This indicator analyzes the first 4-hour candle of each trading day to define a daily price range by marking its high, low, and close levels. These levels serve as key reference points commonly used by institutional traders and algorithms at the start of each session. The indicator also evaluates 15-minute swing structure to determine current market bias, displaying Bullish, Bearish, or Ranging conditions with labeled swing highs and lows. Visual elements include a red line for the 4H candle high (potential resistance), green line for the low (potential support), blue line for the previous 4H candle close (mid-range liquidity), and a gold vertical line marking when these levels are confirmed. All lines are fixed once the first 4H candle closes, with no repainting. Customizable settings allow control over history length, visibility of lines and markers, and swing detection sensitivity. Typical use cases involve identifying daily range breakouts or reversals during key market open times, using the 4H close as a target or confluence level, and combining with Smart Money Concepts or related frameworks for trade entries. The indicator is suited for intermediate to advanced intraday traders, especially those using 5-minute or 1-minute charts for precise entries. It supports any market but is optimized for indices. Levels appear only after the first 4H candle closes, with timing dependent on broker candle alignment.
Indicator profile
Indicator category
Market structure (SMC)
Output type
Filter
Data requirements
Bars only

Customer reviews

0.0
Reviews: 0
Customer reviews
No reviews for this product yet. Already tried it? Be the first to tell others!

Discussion

FAQ

Key Levels
BOS
Liquidity Grab
Products available through cTrader Store, including trading bots, indicators and plugins, are provided by third-party developers and made available for informational and technical access purposes only. cTrader Store is not a broker and does not provide investment advice, personal recommendations or any guarantee of future performance.

More from this author

Indicator
Volume
Key Levels
+2
Support and resistance from a rolling volume profile, ranked by strength or recency, updated live.

You may also like

Indicator
Forex
Signal
+4
Gann Pivot Vision is an innovative analytical tool that combines classic pivot reversal levels and Gann geometry
Indicator
MSS
Key Levels
+2
Fractal based market structure indicator that identifies HH, HL, LH, and LL pivot with confirmed, non-repainting fractal
Indicator
Forex
BTCUSD
+13
Sniper Zone Pro: High-precision institutional zones and candle strength for identifying key market tests.
Indicator
Grid
Prop
+16
Those who are involved in trading know how important it is to take into account the previous session. With Order Block
Indicator
Support & Resistance
Detects Gartley, Bat, Butterfly, Crab, Shark & Cypher patterns and backtests each one's real win rate.
Indicator
Signal
Fractal Arrow Buy and Sell Indicator
Indicator
Pin Bar
Inducement
+5
Institutional Nasdaq Session Liquidity Map with Live Point HUD, Sweep Alerts & Interactive Playbook.
Indicator
ATR
RSI
+3
πŸš€ Specialized algorithm is designed to confirm entry and exit points with precision 🎯
Indicator
BOS
MSS
+5
Your entire ICT session map, structure engine, and key levels β€” No manual work. One indicator. Every session!
Indicator
MACD
Key Levels
+2
Trend indicator with multi-timeframe filters, generating signals only on fully completed bricks & candles. No Repaint.
Indicator
MACD
Forex
+5
πŸš€ MACD Pro Trader – Advanced MACD with buy/sell signals, custom MAs & color-coded histograms for smarter trading! πŸ“ˆπŸ”₯
Indicator
Pin Bar
Inside Bar
+2
Advanced candlestick pattern recognition with structural quality scoring, alerts and adaptive chart visuals.
Indicator
Key Levels
Order Block
+5
Pixel-perfect trading zones in a click! Instantly draw, resize & color via hotkeys. Automate your charting routine
Indicator
ATR
RSI
+8
Multi-timeframe market-state dashboard: Score (-100..+100) + UP/NEUT/DN per TF, with optional closed-candle arrows.
Indicator
ATR
Volume
+4
This allows traders to see not just the trend, but whether the momentum itself is overextended.
Indicator
Prop
Forex
+13
Color Volume Bars – Visualize Market Strength Instantly
Indicator
Prop
Forex
+14
Stochastic Momentum Index (SMI) for cTrader optional higher-timeframe source, and clear overbought/oversold levels.
Indicator
AI
ATR
+23
Candle Timer best used for Scalper

Price

1
Sales


















