Açıklama
ICCandle for cTrader
Bu grafik son kez böyle göründüğünde ne olduğunu cTrader'dan ayrılmadan öğrenin.
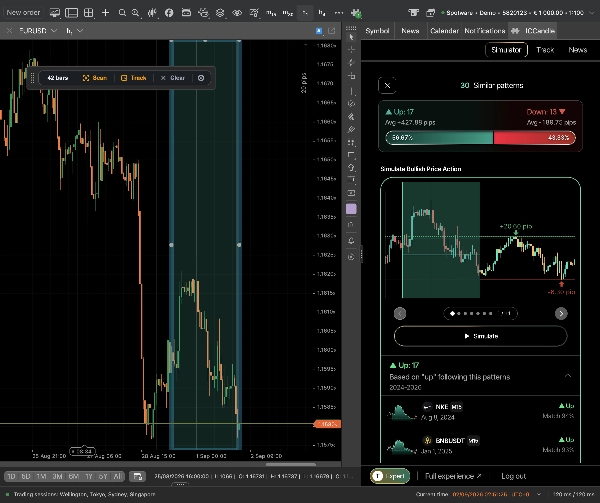
ICCandle, desen arama ve haber tepkisi araştırma eklentisidir. Grafiğinizde bir bar aralığı seçin ve ICCandle, 50 enstrüman arasında en çok benzeyen anları tarihsel indeksinde arar. Eşleşmeler, cTrader içinde yerleşik bir panelde geri gelir ve orada tıkladığınız her şey yerel grafiğinize çizilir: eşleşen desenin barları, bu eşleşmelerden sonra fiyatın nasıl hareket ettiğinin animasyonlu bir projeksiyonu ve — haber tarafında — gerçek yayın sonrası yüksek, düşük ve pip tepkisi ile olay çizgileri.
Araştırma ve işlem yaptığınız grafik aynı ekranda kalır.
Eklentinin ekledikleri
Grafik tarayıcı araç çubuğu — Grafikte küçük sürüklenebilir bir kart. *Aralık seç* son barlar üzerinde yeniden boyutlandırılabilir bir dikdörtgen bırakır ve bu dikdörtgen tam mumlara yapışır. Tarama tam olarak o mumları yükler ve sıralanmış tarihsel eşleşmeleri döndürür. *Takip* aynı seçimi sürekli bir uyarıya dönüştürür.
Hayalet mum tekrar oynatma — Bir eşleşme seçin ve eklenti, o eşleşmenin *sonraki* mumlarını mevcut barınızdan itibaren her 150 ms'de bir ileriye doğru animasyonla oynatır. Projeksiyon, yerel volatiliteye (desenin ortanca gövde büyüklüğü ile son ~50 barınız karşılaştırılarak, mevcut kapanışa sabitlenmiş) göre yeniden ölçeklendirilir, böylece sessiz bir 2019 oturumundan gelen bir eşleşme, bugünün grafiğinde 2019'un genliğiyle çizilmez. Projeksiyon sığmazsa önce grafik uzaklaştırılır, sonra oynatılır.
Ekonomik haber bindirmeleri — Haber görünümü, para birimi etiketli dikey olay çizgileri çizer. Zaten yayınlanmış bir olaya tıklayın ve grafikte olay sonrası etki kutuları görürsünüz: yüksek, düşük, orta ve pip hareketi. Yaklaşan bir olaya tıklayın ve çevresindeki barlar bağlam için panele aktarılır.
Desen takipçisi — Seçilen şekli, seçilen semboller, zaman dilimleri ve oturum penceresi boyunca izlenen bir uyarı olarak kaydedin, böylece siz onu aramak yerine o sizi bulur.
Desen bindirmeleri — Panelde seçtiğiniz herhangi bir desen, klasik veya özel, yerel grafikte vurgulanır ve yerinden sürüklenemeyecek şekilde kilitlenir.
İş akışınıza nasıl uyuyor
Sipariş biletinden önce, "bu kurulum alınmaya değer mi" adımında oturur.
1. Algo → Eklentiler altında ICCandleEmbed'i etkinleştirin, ardından grafik araç çubuğundaki ICCandle düğmesine tıklayın. Panel sağda açılır; tarayıcı araç çubuğu grafikte görünür.
2. Panel içinde bir kez oturum açın. Oturum kalıcıdır, böylece yeniden başlatmalar bunu atlar.
3. Bir formasyon fark edersiniz. Üzerine aralığı çizin ve Tarama düğmesine basın.
4. Sıralanmış eşleşmeleri okuyun, üzerlerine tıklayın ve her birinin ardından gelen hareketi kendi volatilitenizde canlı grafikte izleyin.
5. Normal cTrader biletinde işlem yapın veya Takip düğmesine basın ve bir dahaki sefere sizi uyaracak şekilde bırakın.
Haberlerde akış tersine döner: Haberler sekmesini açın, planlananları görün, ardından aynı yayının geçmiş bir örneğine tıklayın ve bu çiftin aslında ne kadar hareket ettiğini görün.
Panel ve grafik otomatik olarak senkronize kalır. Panelde sekmeler arasında geçiş yapmak tarayıcıyı gösterir veya gizler ve artık geçerli olmayan bindirmeleri temizler, ayrıca panel her zaman grafiğinizin mevcut zaman dilimini bilir.
Tipik kullanım durumları
Gönüllü bir kurulumu doğrulama. EURUSD 1H'de çift dip görüyorsunuz. Tarayın. Çoğunlukla yukarı çözülen otuz tarihsel benzer, %50/%50 bölünmeden çok farklı bir işlemdir. Tekrar oynatma, sadece kazanma oranı değil, tipik sonucun şekil ve ölçeğini gösterir.
Bir haber işlemini boyutlandırma. NFP veya CPI açıklamasından önce, geçmiş yayınları açın ve etki kutularını okuyun: bu çift genellikle tepki penceresi içinde N pip hareket eder. Bu bir durdurma mesafesi ve hedef girdisidir, yön çağrısı değil.
Bir kırılmanın devam edip etmeyeceğini değerlendirme. Konsolidasyon ve kırılma barını seçin ve tarayın. Hemen geri çekilen eşleşmeler, sadece grafikle anlaşılamayan bir şey söyler.
Piyasa çapında desen avı. Sembolleri mevcut grafiğin yerine tüm izleme listenize ayarlayın ve taramanın istediğiniz şekli oluşturan enstrümanı bulmasına izin verin.
Pasif izleme. Tekrarlanan her desen, oturum penceresiyle birlikte takipçiye gider.
Kimler için
En uygun olanlar orta seviye veya üzeri gönüllü ve yarı sistematik tüccarlar — zaten fiyat hareketini okuyan, işlem yaptığı bir kurulumu olan ve körü körüne takip etmek yerine bunun için tarihsel temel oranlar isteyen tüccarlar.
Özellikle iyi olanlar:
- Forex, altın, endeksler veya kripto üzerinde fiyat hareketi ve desen tüccarları
- Tahminler yerine tepki büyüklüğü verisine ihtiyaç duyan haber ve olay tüccarları
- 15 dakikadan günlük zaman dilimlerine kadar intraday ve swing ufukları
- Manuel "geri kaydırıp benzer kurulumları bulayım" araştırması yapan herkes — bu saatlerce süren işi değiştirir
Daha az uygun olanlar: henüz test edecek bir strateji oluşturmamış acemiler, 15 dakikanın altında çalışan scalperlar ve tamamen otomatik yürütme arayan tüccarlar.
Sınırlamalar ve kullanım notları
- İşlem yapmaz. Sipariş verilmez, pozisyon değiştirilmez, hesap verisi okunmaz. Sadece analiz ve görselleştirme — her yürütme kararı size aittir.
- Bir ICCandle hesabı ve internet bağlantısı gereklidir. Panel, desen indeksi ve haber verileri ICCandle'ın sunucularından sağlanır.
- Tarama için 15 dakikalık çözünürlük veya daha yüksek gerekir. İndeks 15M altını içermez, bu yüzden tarayıcı grafik zaman diliminiz ne olursa olsun varsayılan olarak 15M'dir.
- Sadece 50 indekslenmiş enstrüman taranabilir veya takip edilebilir. Brokerınız daha fazlasını sunar; katalog dışındaki semboller seçicilerden filtrelenir, sessizce sıfır eşleşme döndürmek yerine.
- Seçim boyutu zorunludur: 10–100 bar, 50'nin üzerindeyse 10'un katları.
- Plan kısıtlaması. Eşleşme sayısı ve model ICCandle aboneliğinize bağlıdır — Ücretsiz 30, Standart 50, Pro 100, Uzman 200 eşleşme; Standart, Plus ve Pro modelleri Pro veya Uzman planı gerektirir. Planınızın üzerindeki seçenekler yükseltme ipucu ile görünür kalır. Başarısız plan sorgulaması Ücretsiz olarak değerlendirilir.
- Hayalet mumlar tarihsel benzerlerdir, tahmin değildir. Benzer görünümlü barlardan sonra fiyatın geçmişte nasıl davrandığını gösterir, bugünün volatilitesine göre yeniden ölçeklendirilir. Benzer şekiller aynı bağlam değildir — rejim, spread, oturum ve yaklaşan olaylar farklıdır. Bunları kendi analizinizle birlikte bir girdi olarak değerlendirin, asla bir tahmin olarak değil.
- Her örnek için bir panel. Araç çubuğu düğmesine tıklamak paneli baştan oluşturur ve kapatmak çizdiği tüm bindirmeleri temizler.
- Tam Erişim hakları gerektirir, çünkü eklenti ICCandle hizmetlerine giden HTTPS çağrıları yapar.
- macOS ve Windows'ta cTrader Desktop.
- Haber oturumları kendi yerel piyasa saatlerini kullanır (New York 09:30–16:00 ET, Londra 08:00–16:30 UK, Tokyo 09:00–15:00 JST, Sydney 10:00–16:00 AEST). Özel pencereler belirttiğiniz zaman dilimiyle gönderilir, böylece hiçbir şey sessizce dönüştürülmez.
Özet
Key features include:
- A chart scanner toolbar for selecting bar ranges and scanning historical matches or setting alerts.
- Ghost-candle replay that animates the price movement following matched patterns, scaled to current market volatility.
- Economic-news overlays displaying event lines with post-release price impact metrics.
- Pattern tracking to monitor specific shapes across symbols, timeframes, and session windows.
- Pattern overlays that highlight selected matches on the chart without altering their position.
The plugin integrates seamlessly into the trader’s workflow, providing historical context before order execution. It supports 15-minute resolution or higher and requires an ICCandle account with internet access. ICCandlePlugin operates solely as an analytical tool without placing trades or accessing account data. It is suitable for intermediate or advanced traders focusing on price action, pattern recognition, and news reaction across forex, gold, indices, and crypto markets.


!["Custom Timeframes [Iridio Capital]" logosu](https://cdn.ctrader.com/image/webp/4d75a920-23c7-4fea-a7b5-594a9d067f2e_63286)