
Açıklama
Flintridge Trader Pro, fiyatın zaten elini gösterdiği yerleri işaretler ve ardından piyasanın bu yerlerde ne zaman döndüğünü size söyler.
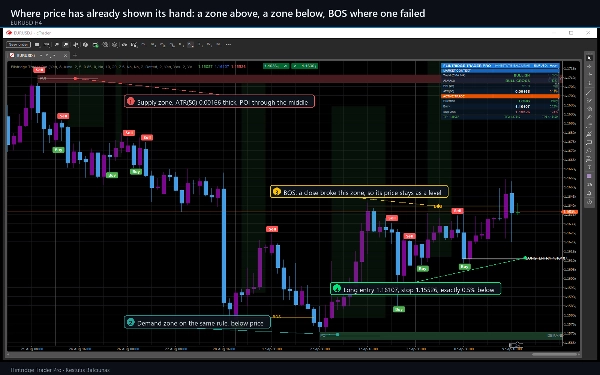
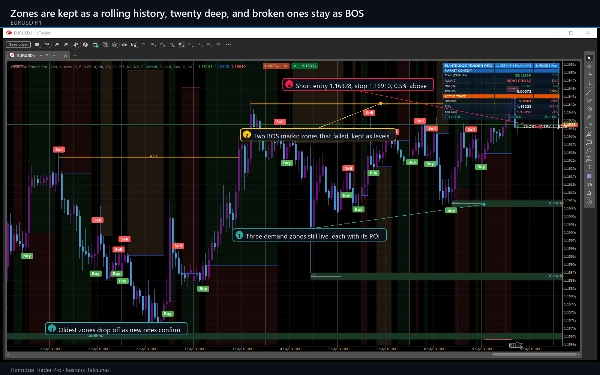
Onaylanmış salınım dönüşleri, her biri ortasında ilgi noktası bulunan ATR kalınlığında bantlar olan arz ve talep bölgeleri oluşturur. Fiyat bir bölgeyi kapattığında, bu yapı kırılması olarak dönüştürülür ve BOS olarak işaretlenir, böylece başarısız olan seviye kaybolmak yerine bilgi olarak grafikte kalır. Ayrı olarak, kapanışların hareketli ortalaması ve açılışların hareketli ortalaması DAHA YÜKSEK bir zaman diliminde hesaplanır - varsayılan olarak grafiğinizin sekiz katı - ve bunların kesişimi sinyaldir.
Grafiğinizde çizdikleri
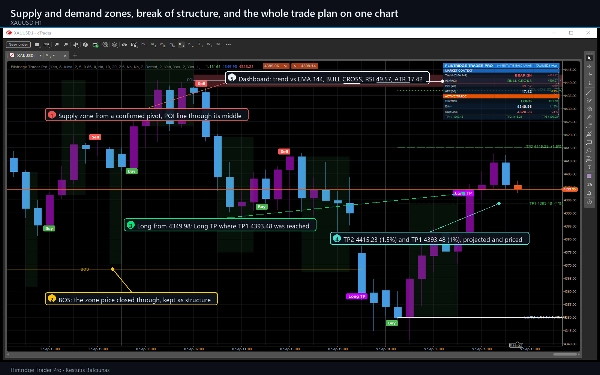
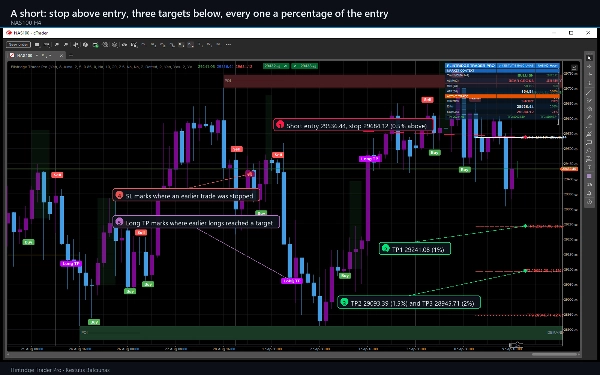
- Onaylanmış salınım dönüşlerinden arz ve talep bölgeleri, her biri bir POI çizgisi ile, kaydırmalı tarihçe olarak tutulur ve kırıldığında BOS işaretine dönüştürülür.
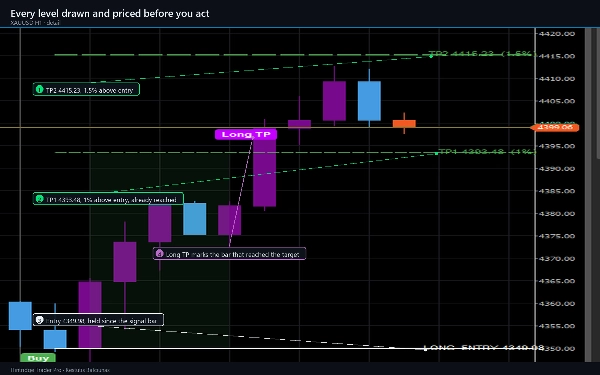
- Bir seviye ulaşıldığında Alış ve Satış işaretçileri ile Uzun TP ve SL işaretçileri.
- Giriş, durdurma ve ilk hedef basamaklı çizgiler olarak, aralarında gölgeli bir risk bandı ve gölgeli bir ödül bandı ile.
- Son sinyal ileriye projekte edilir, giriş, durdurma ve üç hedefin tamamı fiyatları ve yüzdeleri ile çizilir ve etiketlenir.
- İsteğe bağlı HH, LH, HL ve LL salınım etiketleri ve 21 seviyeye kadar destek ve direnç katmanı ile bölgeleri.
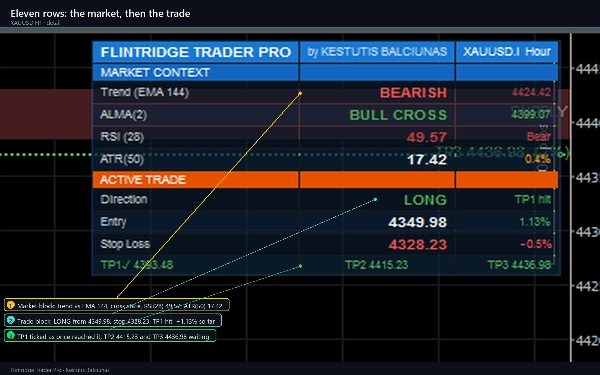
- On bir satırlık gösterge paneli: 144 EMA'ya karşı trend, kesişim durumu, RSI, ATR, ardından yönü, aşaması, girişi, durdurması ve üç hedefi ile canlı işlem, fiyat ulaştıkça işaretlenir.
- Her çubuğun yönü bir bakışta okunabilir şekilde mumlar yeniden renklendirilir.
Nasıl işlem yapılır
- Tarihçe verin. Varsayılan ayarlarda herhangi bir şey görünmeden önce yaklaşık 250 çubuk gerekir ve ilk kesişimin var olması için daha yüksek zaman diliminde yeterli veri gerekir.
- Önce bölgeleri okuyun. Talep bölgesi içinde bir Alış ve arz bölgesi içinde bir Satış, aracın size göstermek için tasarlandığı kurulumlardır.
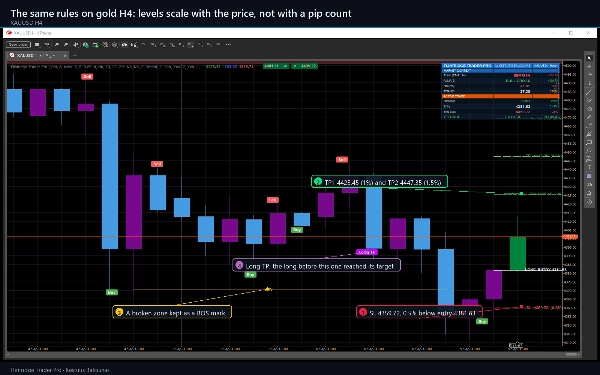
- Çizildiği gibi seviyeleri alın. Durdurma ve üç hedef giriş fiyatının yüzdeleridir, varsayılan olarak 0.5, 1, 1.5 ve 2 ve bunların her biri işlem yapmadan önce grafikte bulunur.
- Bağlam için gösterge panelini kullanın, izin için değil. Trend, kesişim, RSI ve ATR piyasayı tanımlar; bunların hiçbiri isteğe bağlı filtreler açılmadıkça sinyali engellemez.
En önemli ayarlar
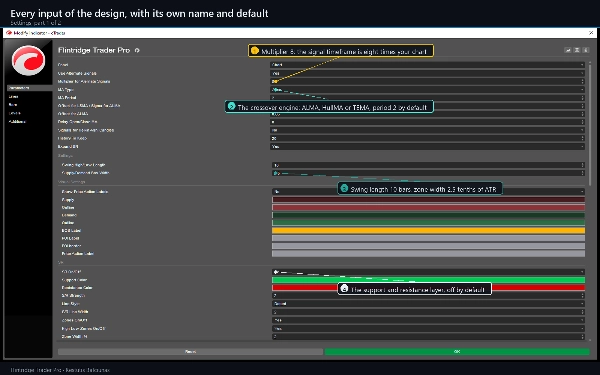
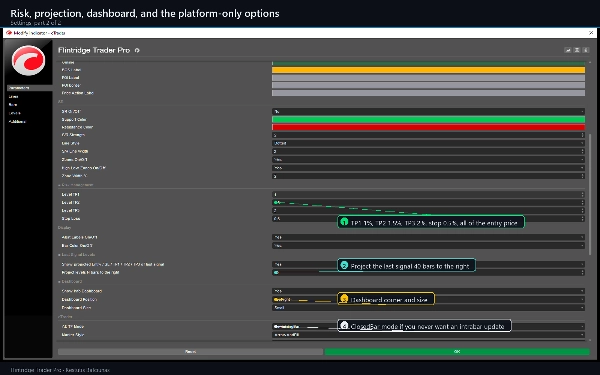
- MA Türü ve MA Periyodu kesişim motorunu seçer: ALMA, HullMA veya TEMA.
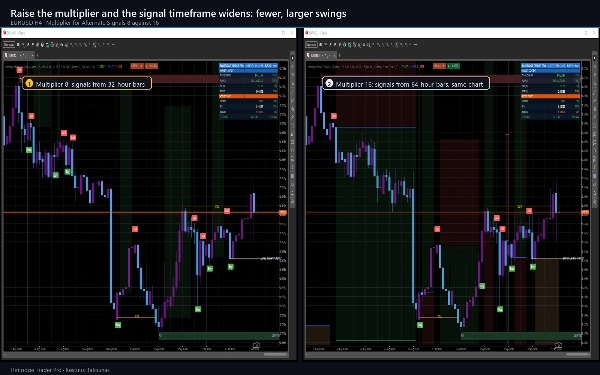
- Alternatif Sinyaller için Çarpan, sinyal zaman diliminin grafiğinizden ne kadar daha yüksek olduğunu belirler.
- Salınım Yüksek/Düşük Uzunluğu ve Arz/Talep Kutusu Genişliği, kaç bölge alacağınızı ve ne kadar kalın olduklarını kontrol eder.
- Seviye TP1, TP2, TP3 ve Durdurma Zarar, girişin yüzdeleridir ve kısa pozisyonlar aynı dört sayıyı kullanır.
- Üç isteğe bağlı filtre - EMA 144 trend kapısı, RSI kapısı ve girişler arasında minimum çubuk boşluğu - daha az sinyal isteyen tüccarlar için sağlanır. Varsayılan olarak KAPALIdır.
Nerede çalışır
Her sembol ve her zaman dilimi. M15, H1 ve H4 etrafında tasarlandı ve forex majörleri, altın ve büyük endekslerde evindedir; ayrıca ATR'nin daha geniş olduğu kripto para birimlerinde de çalışır. Daha düşük zaman dilimleri çok daha fazla sinyal verir, bu da isteğe bağlı filtreler ve daha yüksek zaman dilimi çarpanı ile kontrol edilir.
Uyarılar
Her biri kendi anahtarı olan on iki olay: uzun ve kısa girişler, her yön için üç hedef ve durdurmalar. Bunlar cTrader günlük kaydına, isteğe bağlı bir sese ve cTrader'ın kendi e-postasına gider. Uyarılar yalnızca kapanmış çubuklarda tetiklenir, göstergeye eklenmeden önce kapanmış tarih için asla tetiklenmez ve aynı çubuk için iki kez tetiklenmez.
Gereksinimler ve davranış
cTrader 5.0 veya daha yenisi, masaüstü. Gösterge erişim hakları beyan etmez: ağ bağlantısı açmaz, dosya okumaz ve asla emir vermez, değiştirmez veya kapatmaz. Bir sinyal kapanmış bir çubukta değerlendirilir ve sonrasında hareket etmez. En yeni çubuk oluşurken iki şey geçicidir - henüz onaylanmamış pivotu olan en yeni bölge ve mevcut çubuğu içeren çubuktan okunan daha yüksek zaman dilimi değeri. Önceki tamamlanmış daha yüksek zaman dilimi çubuğunu okumak için bir ayar sağlanır, bu asla yeniden boyanmaz.
Bu analitik bir yazılımdır ve çizdiği hiçbir şey tavsiye değildir. Hedef ve durdurma işaretleri yalnızca fiyatın yüklü tarihçede çizilen bir seviyeye dokunduğunu kaydeder; arkasında spread, komisyon veya kayma yoktur ve emir verilmemiştir.
Ticaret risk içerir. Geçmiş performans gelecekteki sonuçları garanti etmez.
Özet
Key chart elements include supply and demand zones with points of interest, buy/sell markers, entry, stop loss, and three target levels displayed as stepped lines with shaded risk and reward bands. Optional swing labels (HH, LH, HL, LL) and a support/resistance layer with up to 21 levels are available. An eleven-row dashboard provides market context with trend, crossover state, RSI, ATR, and live trade details including stage, entry, stop, and targets.
Flintridge Trader Pro supports any symbol and timeframe, optimized for M15, H1, and H4 charts, and is suitable for forex majors, gold, major indices, and cryptocurrencies. It includes configurable settings for moving average type, swing length, zone width, and risk parameters. Alerts cover entries, targets, and stops, firing on closed bars only. The indicator is analytical software that does not place or manage orders.