present
Zarejestruj się i otrzymaj 50 $ zniżki na pierwszy zakup
Trading product for Helix Volume Profile Wskaźnik Key Levels Volume, image 1
Helix Volume Profile
Wskaźnik
Wersja 1.0, Sep 2026
Windows, Mac
4.0
Opinie: 1
Trading product for Helix Volume Profile Wskaźnik Key Levels Volume, image 2
Trading product for Helix Volume Profile Wskaźnik Key Levels Volume, image 3
Trading product for Helix Volume Profile Wskaźnik Key Levels Volume, image 4
Trading product for Helix Volume Profile Wskaźnik Key Levels Volume, image 5
Trading product for Helix Volume Profile Wskaźnik Key Levels Volume, image 6
Trading product for Helix Volume Profile Wskaźnik Key Levels Volume, image 7
Trading product for Helix Volume Profile Wskaźnik Key Levels Volume, image 8
Trading product for Helix Volume Profile Wskaźnik Key Levels Volume, image 9
Trading product for Helix Volume Profile Wskaźnik Key Levels Volume, image 10
Trading product for Helix Volume Profile Wskaźnik Key Levels Volume, image 11
15
Sprzedaż
299
Bezpłatne instalacje

Opis

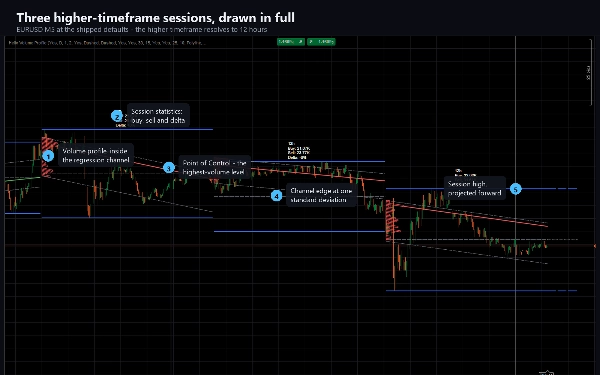
Helix Volume Profile tworzy pełny obraz sesji o wyższym interwale czasowym, w której znajduje się aktualny wykres.

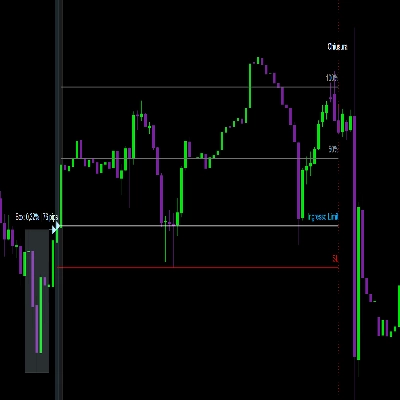
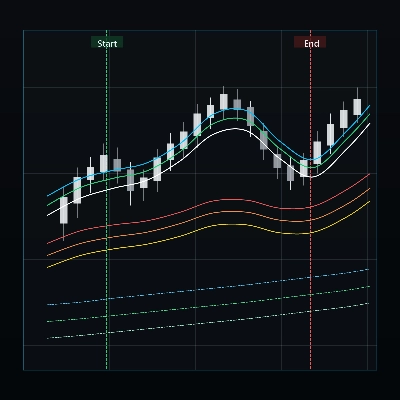
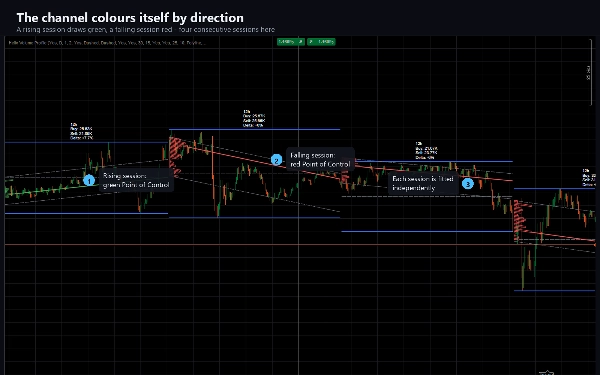
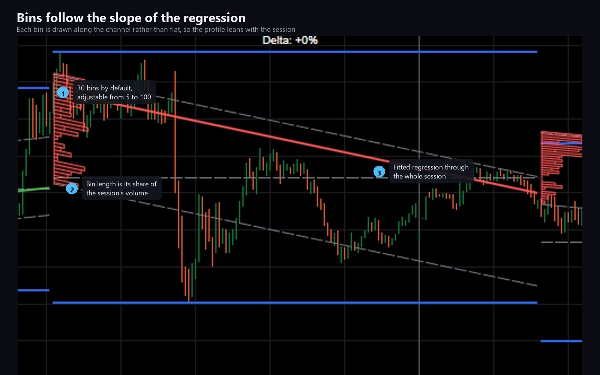
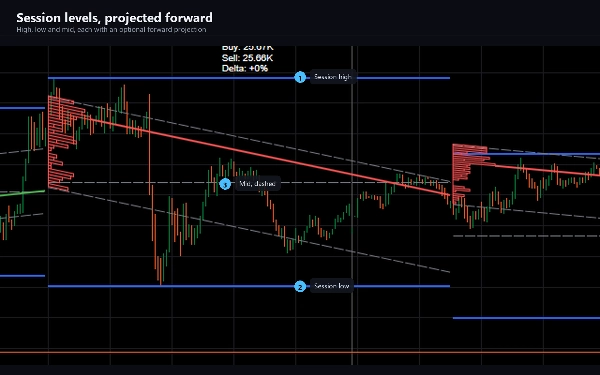
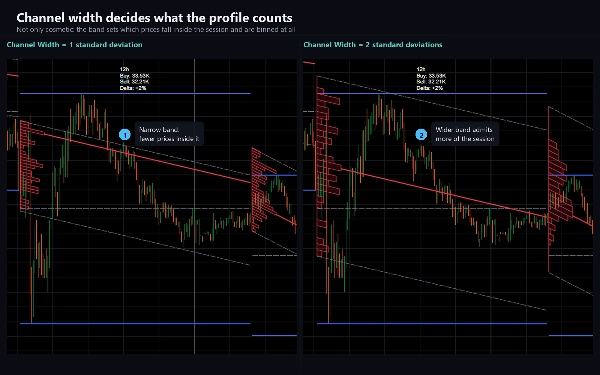
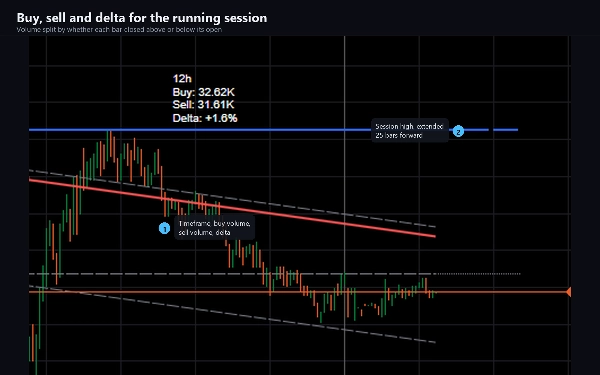
Dla każdej sesji dopasowuje regresję logarytmiczną do każdego słupka do tej pory, rysuje kanał o konfigurowalnej szerokości wyrażonej w liczbie odchyleń standardowych wokół niej i wypełnia ten kanał profilem wolumenu, którego przedziały podążają za nachyleniem regresji, a nie leżą płasko. Najwyższy wolumen jest oznaczony linią Punktu Kontroli, pokolorowaną zgodnie z kierunkiem ruchu kanału. Wysoki, niski i środkowy poziom sesji są rysowane obok i mogą być projektowane do przodu, a kompaktowa etykieta raportuje wolumen kupna, wolumen sprzedaży oraz różnicę między nimi.

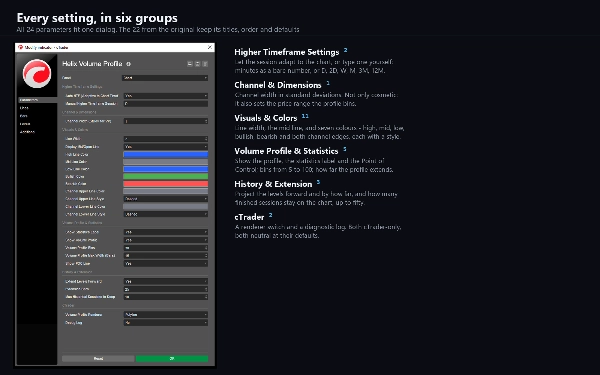
Wyższy interwał czasowy jest domyślnie wybierany dla Ciebie i dostosowuje się do wykresu: sesja 12-godzinna na M5, cztery godziny na M1, dwa dni na M15, tydzień na H1, miesiąc na H4. Możesz to wyłączyć i ustawić sesję samodzielnie – akceptowane są minuty, dni, tygodnie lub miesiące.

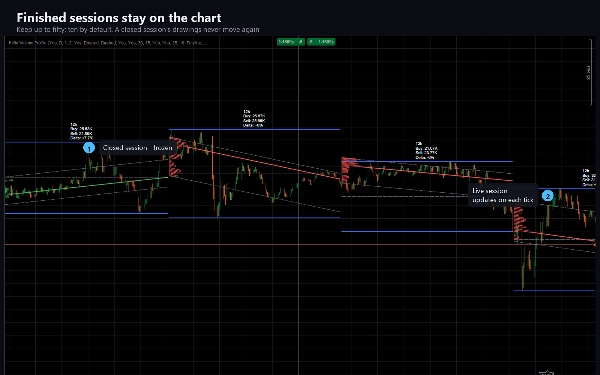
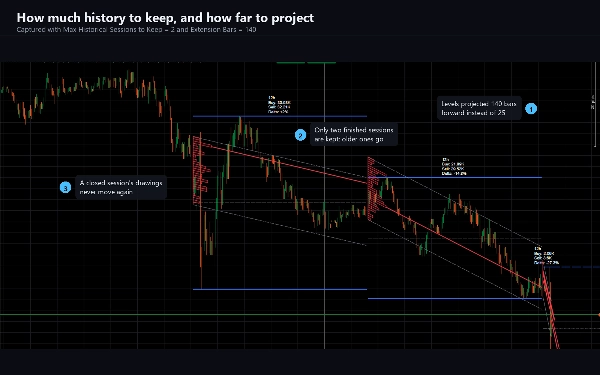
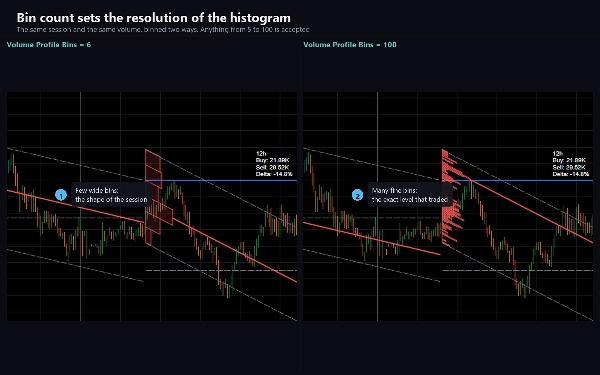
Wszystko jest regulowane. Szerokość kanału, liczba przedziałów profilu od 5 do 100, jak daleko profil sięga, czy wyświetlany jest Punkt Kontroli, etykieta statystyk i projekcje do przodu, szerokości i style linii, siedem kolorów oraz ile zakończonych sesji pozostaje na wykresie, do pięćdziesięciu.

DO CZEGO TO SŁUŻY

Odczytywanie, gdzie cena znajduje się w strukturze wyższego interwału czasowego bez opuszczania aktualnego interwału pracy. Kanał pokazuje dryf i rozproszenie sesji; profil pokazuje, gdzie faktycznie zgromadził się wolumen; Punkt Kontroli oznacza poziom z największą aktywnością. Traderzy używają tego do określania wsparcia i oporu, oceny, czy ruch jest przesadzony względem sesji oraz do sprawdzenia, czy dominowały zakupy czy sprzedaż.

Odpowiedni dla każdego instrumentu i każdego interwału czasowego. Najbardziej informacyjny na wykresach intraday od M1 do H4, gdzie adaptacyjna sesja daje znaczące okno; na wykresach dziennych i wyższych ustaw sesję ręcznie.

JAK SIĘ ZACHOWUJE

Sesja na żywo aktualizuje się przy każdym ticku, a jej rysunki przesuwają się aż do zamknięcia sesji – kanał jest ponownie dopasowywany, profil odbudowywany, a poziomy ponownie mierzone z każdym pojawiającym się słupkiem. Po zakończeniu sesji jej rysunki zostają zamrożone i już się nie zmieniają. Jest to celowe i tak działa ta metoda; jeśli potrzebujesz poziomów, które nie zmieniają się w trakcie słupka, czytaj zamkniętą sesję, a nie sesję na żywo.

Wolumen na symbolu forex to liczba ticków raportowana przez Twojego brokera, więc profil odzwierciedla Twój własny feed.

TECHNICZNE

Wskaźnik, nakładka. 24 parametry. Brak uprawnień do handlu, brak dostępu do plików i sieci – jest zbudowany z AccessRights ustawionym na None i nie może składać zleceń. Zawiera wersję próbną ograniczoną do EURUSD bez limitu czasowego i bez wyłączonych funkcji.

Dokumentacja obejmuje instalację, każdy parametr z jego przeznaczeniem oraz przewodnik rozwiązywania problemów wyjaśniający każde zachowanie, które może zaskakiwać użytkowników.

Trading wiąże się z ryzykiem. Wyniki historyczne nie gwarantują przyszłych rezultatów.

Podsumowanie

Podsumowanie AI
Helix Volume Profile is a technical indicator overlay designed to analyze higher-timeframe sessions within the current chart timeframe. It fits a logarithmic regression channel to the session's price bars, adjustable by standard deviations, and overlays a volume profile aligned with the channel's slope. The indicator highlights the Point of Control—the price level with the highest traded volume—colored according to the channel's direction. It also displays session high, low, and midpoint levels, which can be projected forward, alongside a label showing buy volume, sell volume, and their delta.

The higher timeframe session adapts automatically based on the chart timeframe (e.g., 12 hours on M5, one week on H1) but can be manually set to minutes, days, weeks, or months. Users can customize channel width, number of volume bins (5 to 100), profile extension, visibility of elements, colors, line styles, and how many past sessions remain visible (up to 50).

The live session updates on every tick, recalculating the channel and volume profile until session close, after which the data is fixed. Volume data reflects the broker's tick count for forex symbols. Helix Volume Profile is suitable for any instrument and timeframe, with particular utility on intraday charts from M1 to H4. It includes 24 adjustable parameters and operates without trading permissions or network access.
Profil wskaźnika
Kategoria wskaźnika
Trend
Typ wyjścia
Wizualizacja
Wymagania dotyczące danych
Wolumen

Dyskusja

Opinie klientów

4.0
Opinie: 1
5
0 %
4
100 %
3
0 %
2
0 %
1
0 %
Opinie klientów
September 18, 2026
Helix Volume Profile combines a sloped regression channel with a direction-aware volume profile, session H/L/Mid levels and forward projections. The profile rendered cleanly on EURUSD and XAUUSD across M1/H1. The main caveat is that the enabled buy/sell/delta statistics label was not visible.

Częste pytania

Key Levels
Volume
Market Structure
Channel
Support & Resistance
Produkty dostępne za pośrednictwem cTrader Store, w tym boty handlowe, wskaźniki i wtyczki, dostarczane są przez deweloperów zewnętrznych i udostępniane wyłącznie w celach informacyjnych oraz w celu zapewnienia dostępu technicznego. cTrader Store nie jest brokerem i nie zapewnia doradztwa inwestycyjnego, nie udziela spersonalizowanych rekomendacji ani nie gwarantuje przyszłych wyników.

Więcej od tego autora

Wskaźnik
ATR
EMA
+3
EMA cross filtered by a trend average and its ATR channel, with long, short and close marks and colored candles.
cBot
Balanced
Fixed Lot
+5
Gold grid cBot for XAUUSD H1: four-signal confluence on closed bars, ladders closed at a basket profit, news filter
15.6%
ROI
2.33
Współczynnik zysku
Wskaźnik
ATR
CCI
+4
A trend line that never steps back, a shaded band to the price, and a pointer at the swing where the trend turns.
Wskaźnik
ADX
ATR
+5
EMA-cross signals scored on six confluence layers, with an ATR stop, three targets and a live panel
Wskaźnik
ATR
RSI
+5
Fusion trend line with a layered cloud, BULL and BEAR labels, scored re-entry triangles and exit markers.
Wskaźnik
ATR
RSI
+4
Adaptive Ichimoku with nine-factor confluence scoring, five signal types, smart TP/SL and an MTF panel.
Wskaźnik
ATR
RSI
+4
RSI bands drawn on price, confluence-scored BUY/SELL signals, an ATR stop with three targets
Wskaźnik
ADX
ATR
+5
SuperTrend signals scored on five confluence factors, with an ATR stop, three targets and a dashboard.
Wskaźnik
ADX
ATR
+5
Ten confluence layers scored on every closed bar, with an anti-chop gate, pivot levels and a live dashboard.
cBot
TP Manager
Break Even
+5
Gold cBot for prop-firm accounts: pick your firm, phase and size; risk is sized from the firm's rules, its limits kept
1.6
Współczynnik zysku
Wskaźnik
ATR
EMA
+2
Eight-EMA ribbon with ATR trade zones, a nine-symbol screener and a five-timeframe trend dashboard.
Wskaźnik
ATR
Volume
+3
Fibonacci trend signals on closed bars, with an ATR stop, up to four targets and a break-even ladder.

Możesz także polubić

Logo „ATR Bands”
Popularne
4.7
(4)
$19
Wskaźnik
ATR
Prop
+13
Enhance trading with ATR Bands! Visualize market volatility using dynamic upper and lower ATR bands for precise decision
Wskaźnik
Forex
Crypto
+2
Unique Pyramid Design , Clear Price Action Trend
Wskaźnik
AI
Forex
+5
Dynamic, color‑coded candles reveal market shifts instantly—spot momentum and trend reversals at a glance
Logo „IVB 2.0”
Najwyżej oceniane
4.6
(5)
$19
Wskaźnik
IVB 2.0 is an indicator that works on the strategy of imbalance of the maximum volatility box of indices
Wskaźnik
Prop
Forex
+12
⚡ ADXVMA Aurora Trend Filter combines ADX trend strength with an adaptive EMA blend ⚡
Wskaźnik
Forex
BTCUSD
+5
Multi-timeframe moving averages with session lines for structured trend analysis directly on the chart.
Wskaźnik
ADX
ATR
+2
GOLD SENTINEL v1.0 - A CANDLE-COLORING INDICATOR FOR GOLD.
Wskaźnik
AI
ATR
+27
COT Flows. Clear Direction. 🧭
Wskaźnik
ATR
RSI
+4
RSI bands drawn on price, confluence-scored BUY/SELL signals, an ATR stop with three targets
Wskaźnik
Forex
Crypto
+2
Market Structure Indicator – Your Trading Map in a Noisy Market. No more Panicking Which one, Where, Why and How.
Wskaźnik
MACD
Forex
+1
😎Read the description before purchasing💩
Wskaźnik
ATR
RSI
+1
Super Trend Rsi ,ATR + trend change distance + dynamic Alpha, divergence/convergence
Wskaźnik
Doji
Volume
+5
Instantly spot high-liquidity institutional moves with clean, non-obtrusive triangle alerts on cTrader charts.
Wskaźnik
Fair Value Gap
Liquidity Grab
+2
PRO Liquidity Sweep + FVG Combo detector with custom Gold/Blue signals & alerts
Logo „Major Tops and Bottoms”
Najwyżej oceniane
4.2
(4)
$29
Wskaźnik
Signal
Scalping
Average accuracy of around 60% to 70% on 45min timeframes it is highly recommended to use stop losses
Wskaźnik
Risk Dashboard
AI-powered daily range forecasts help traders spot volatility opportunities and plan stops and targets.
Wskaźnik
ATR
BTCUSD
+5
Trailing algo 📈 auto-tracks trends 🎯 adapts to volatility 🌟 precise moves 🛡️ retest signals 🚀 no lag, smart market
Wskaźnik
SMC
Prop
+16
Multi-Time Frame Candlesticks FVG with BSL/SSL Premium Suite

Cena

15
Sprzedaż
299
Bezpłatne instalacje