Descrizione
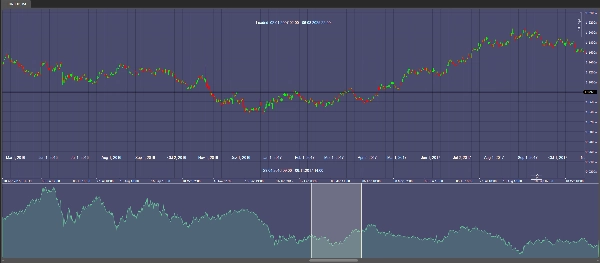
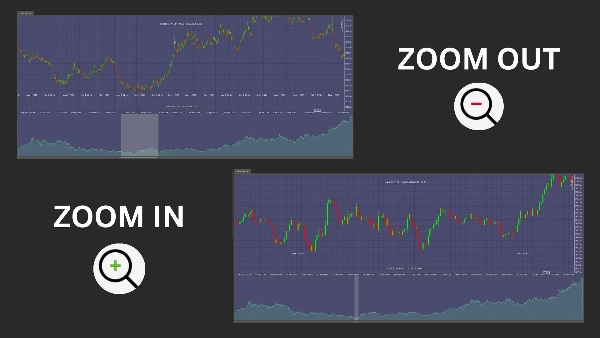
ChartOverview ti tiene completamente informato sull'intera gamma di dati del mercato, dal primo all'ultimo punto dati disponibile. Nella parte superiore del tuo grafico, vedi una chiara visualizzazione dell'intervallo di tempo completo caricato, mentre il periodo attualmente visibile è mostrato direttamente sul grafico per approfondimenti in tempo reale.
Questo indicatore dinamico si aggiorna senza interruzioni mentre scorri, trascini o ridimensioni il grafico, assicurandoti di avere sempre informazioni aggiornate. Il suo design intuitivo ti permette di identificare rapidamente le tendenze e le opportunità di mercato, migliorando la tua capacità di prendere decisioni di trading tempestive e ben informate.
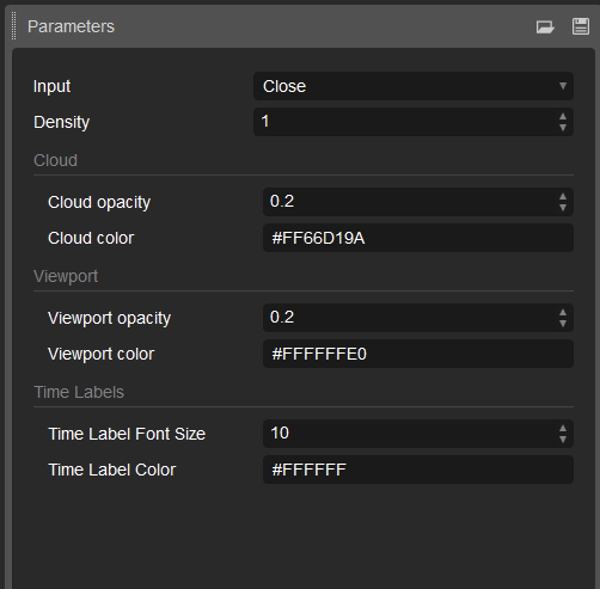
Con ampie opzioni di personalizzazione per colori, opacità e impostazioni di visualizzazione, ChartOverview si integra perfettamente nel tuo setup di trading personale. Potenzia la tua analisi e ottieni un vantaggio competitivo con uno strumento progettato per offrire una panoramica di mercato precisa e completa.
Riepilogo
Recensioni dei clienti
5 | 100 % | |
4 | 0 % | |
3 | 0 % | |
2 | 0 % | |
1 | 0 % |