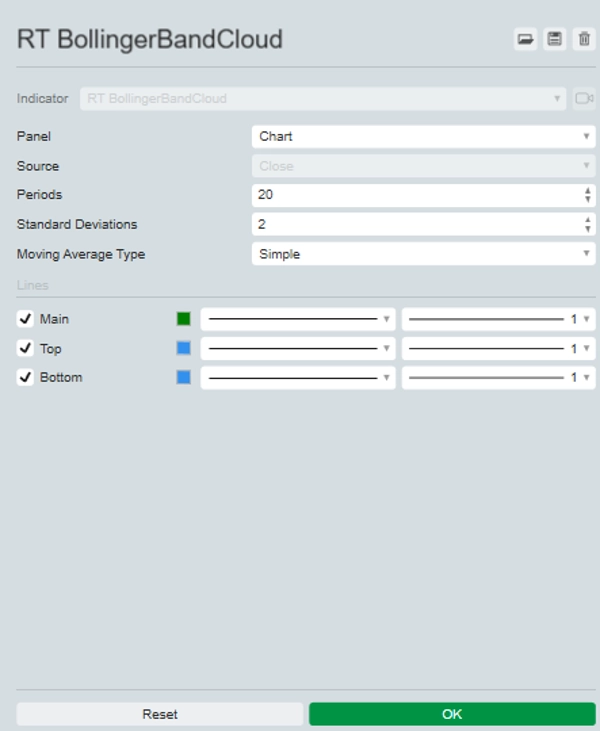
RT Bollinger Bands Cloud
อินดิเคเตอร์
เวอร์ชัน 1.0, Sep 2024
Windows, Mac
คำอธิบาย
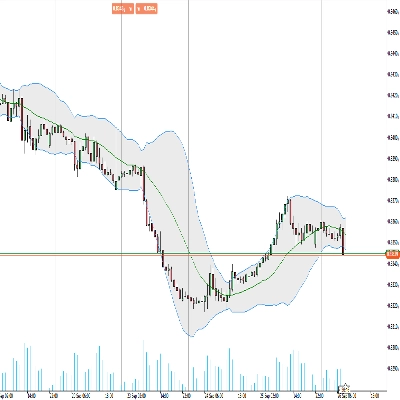
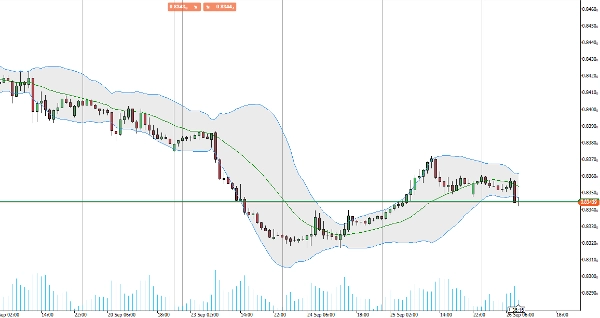
แนะนำตัวบ่งชี้ Bollinger Bands ที่ได้รับการปรับปรุงของเรา ออกแบบมาเพื่อยกระดับประสบการณ์การเทรดของคุณด้วยการแสดงผลที่ชัดเจนยิ่งขึ้น
การปรับปรุงด้านภาพนี้ช่วยให้ตีความความผันผวนของตลาดและระบุจุดที่อาจเกิดการเบรคเอาท์และการกลับตัวได้ง่ายขึ้น เหมาะสำหรับเทรดเดอร์ที่ต้องการข้อมูลเชิงลึกที่ชัดเจนและการตัดสินใจที่ดีขึ้น
อัปเกรดชุดเครื่องมือการเทรดของคุณวันนี้เพื่อการวิเคราะห์ที่เฉียบคมและผลลัพธ์ที่ดีกว่า
สรุป
โปรไฟล์อินดิเคเตอร์
รีวิวจากลูกค้า
0.0
รีวิว: 0
รีวิวจากลูกค้า
ยังไม่มีรีวิวสำหรับผลิตภัณฑ์นี้ หากเคยลองแล้ว ขอเชิญมาเป็นคนแรกที่บอกคนอื่น!
การสนทนา
คำถามที่พบบ่อย
BTCUSD
Forex
Breakout
Indices
EURUSD
Commodities
GBPUSD
NZDUSD
Bollinger
Scalping
Crypto
Stocks
XAUUSD
NAS100
USDJPY
ผลิตภัณฑ์ที่มีให้บริการผ่าน cTrader Store รวมถึงบอทการเทรด อินดิเคเตอร์ และปลั๊กอิน มีให้บริการโดยนักพัฒนาบุคคลที่สามและมีไว้เพื่อวัตถุประสงค์ในการเข้าถึงข้อมูลและทางเทคนิคเท่านั้น cTrader Store ไม่ใช่โบรกเกอร์และไม่ได้ให้คำแนะนำการลงทุน คำแนะนำส่วนบุคคล หรือการรับประกันผลการดำเนินงานในอนาคต


ราคา
ตั้งแต่ 25/09/2024
20
การขาย