
Correlations Map for cTrader: Spot Stacked Risk in One Table #Shorts
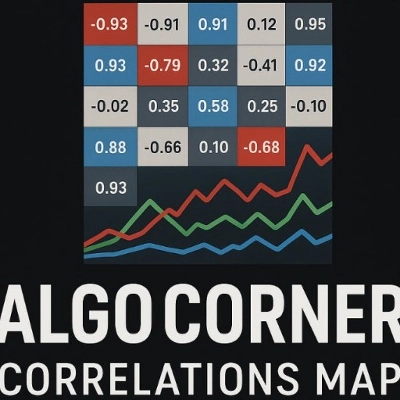
Check the correlations between dozens of assets in one elegant display.
AlgoCorner
18 Nov 2026
·
0:46
·
27
About this video
Are two of your trades secretly the same bet? Correlations Map is a cTrader indicator that shows how your symbols move against each other, in one color-coded table right on your chart. Correlation runs from +1 (they move together) to -1 (they move opposite). • Strong positive, strong negative and weak correlations highlighted in colors you choose • As many pairs as your platform allows, on any timeframe, as decimals or percentages • Click any cell to see how that correlation changes over time • An alert when a correlation changes significantly Free trial on the cTrader Store: More: Instagram: @algocornerfx #cTrader #cAlgo #Correlation #RiskManagement #AlgoCorner #Shorts
More videos
Watch more videos of similar products