Description
FedPulse - Fed Policy Analysis Plugin for cTrader
═══════════════════════════════════════════════════
Type: Desktop Plugin | Platform: cTrader | Access Rights: None
WHAT IS FEDPULSE?
─────────────────
Stop switching between CME FedWatch, Treasury websites, and ETF pages.
FedPulse brings everything you need for Fed policy and precious metals
analysis into one unified cTrader panel.
✓ Real-time CME FedWatch rate expectations
✓ DXY and Treasury yield curve monitoring
✓ ETF holdings tracking (GLD, IAU, SLV)
✓ COMEX warehouse inventory data
✓ Gold/Silver ratio with statistical analysis
Built for metals and FX traders who want to stay ahead of Fed policy
shifts without leaving their trading platform.
→ Try the free 7-day trial to explore all features.
WHO SHOULD USE FEDPULSE?
────────────────────────
• Gold/Silver traders monitoring macro fundamentals
• FX traders tracking USD policy direction
• Swing traders timing entries around FOMC events
• Position traders analyzing supply-side data
• Anyone who checks CME FedWatch regularly
PANEL MODULES
─────────────
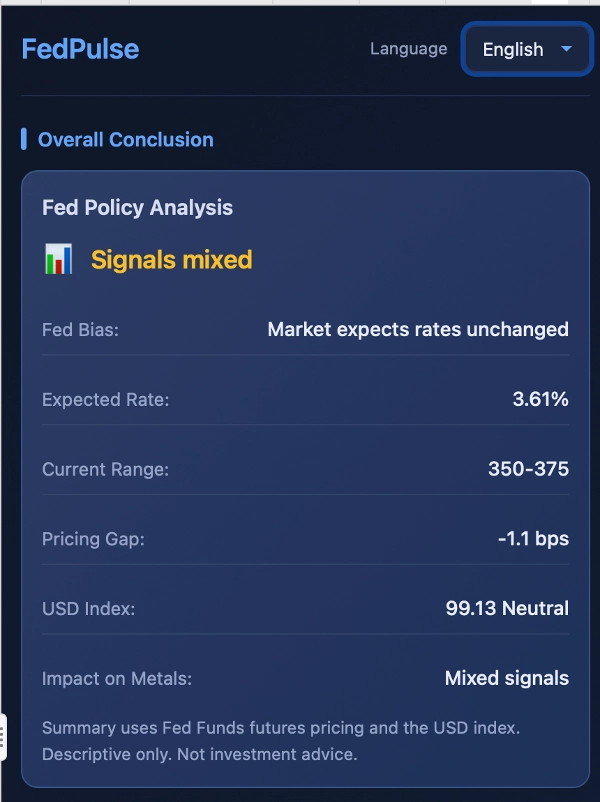
1. Overall Conclusion
A quick summary dashboard showing the key Fed policy stance at a glance.
Displays: Fed Bias, Expected Rate, Current Range, Pricing Gap, DXY,
Impact on Metals
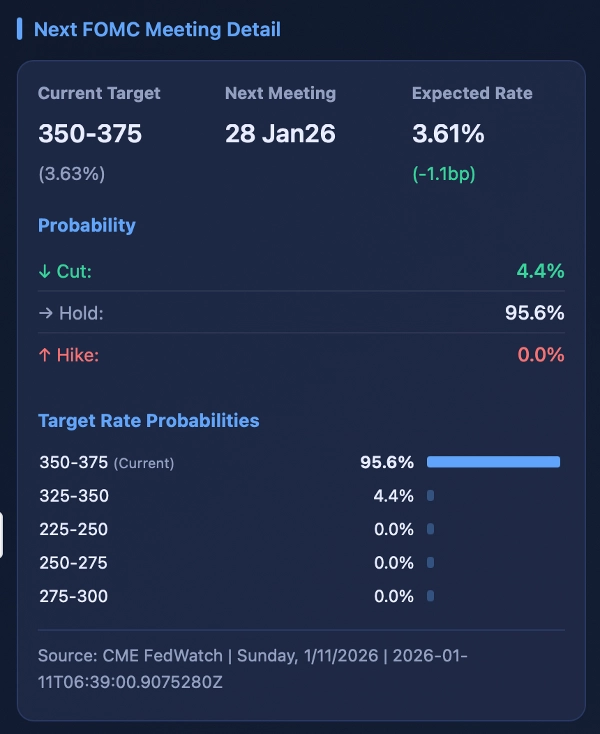
2. CME FedWatch - Next FOMC Meeting
Data Source: CME FedWatch
The Fed Funds futures market prices rate change probabilities for the
next FOMC meeting — the most forward-looking USD monetary policy indicator.
• Hawkish: Expected > Current + 2.5bps → USD strength, Au headwind
• Dovish: Expected < Current - 2.5bps → USD weakness, Au tailwind
• Neutral: Within ±2.5 bps → No clear directional bias
Displays: Current Target, Next Meeting, Expected Rate,
Probability (Cut/Hold/Hike), Rate Distribution
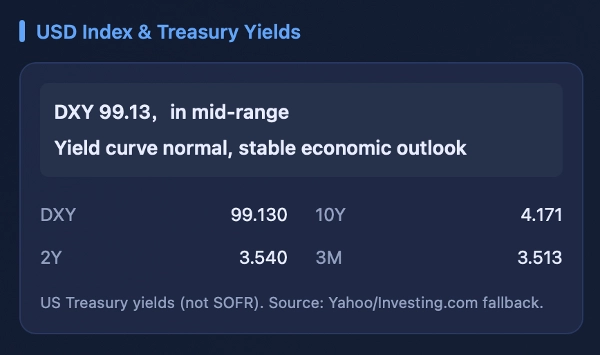
3. USD Index & Treasury Yields
Data Source: Yahoo Finance (primary) / Investing.com (fallback)
Key indicators for understanding economic outlook and USD strength.
• DXY > 105: Very strong USD, commodity headwind
• DXY < 95: Very weak USD, commodity tailwind
• 10Y-2Y < 0 (Inverted): Recession signal, risk-off
• 10Y-2Y > 1% (Steep): Growth outlook, risk-on
Displays: DXY, 10Y/2Y/3M Yields, Yield Curve Interpretation
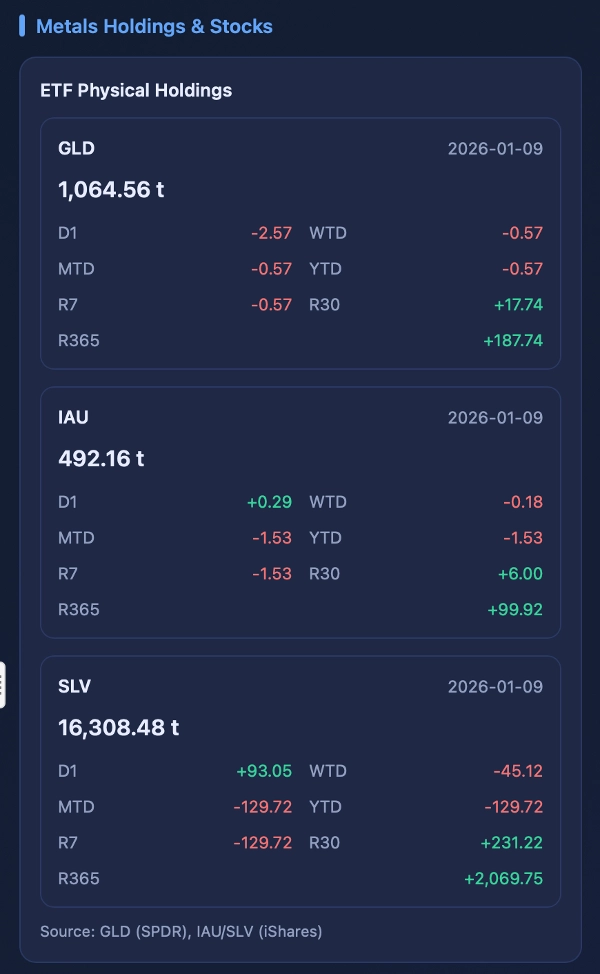
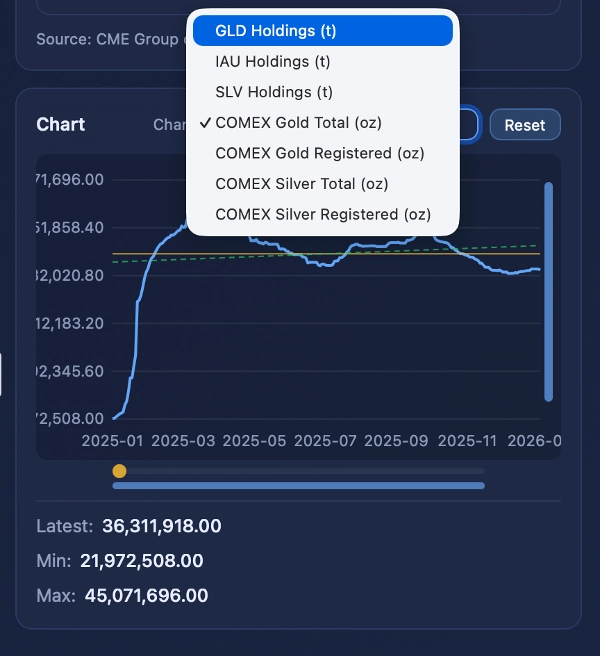
4. Metals Holdings & Stocks
Comprehensive precious metals supply-side data.
Data Sources:
• ETF Holdings: GLD (SPDR), IAU/SLV (iShares)
• COMEX Stocks: CME Group delivery reports
ETF Physical Holdings:
Real-time holdings in tonnes. Rising = accumulation; Falling = liquidation.
Displays: GLD, IAU, SLV holdings
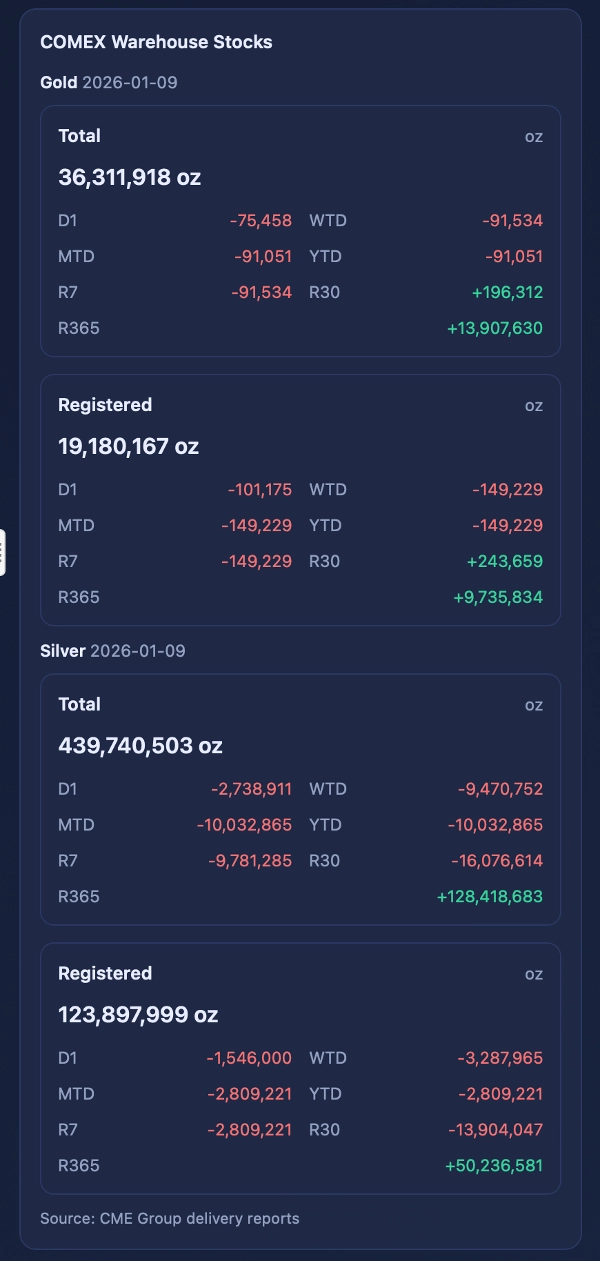
COMEX Warehouse Stocks:
• Total: All metal in COMEX warehouses
• Registered: Metal available for futures delivery
Displays: Gold/Silver Total & Registered (oz)
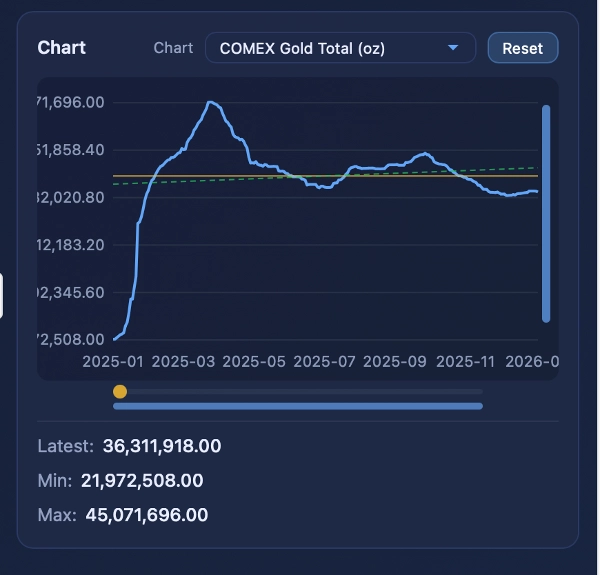
Metals Chart:
Interactive time-series chart with 7 modes (GLD/IAU/SLV holdings,
COMEX Gold/Silver Total/Registered). Features zoom, pan, scroll,
and statistics display.
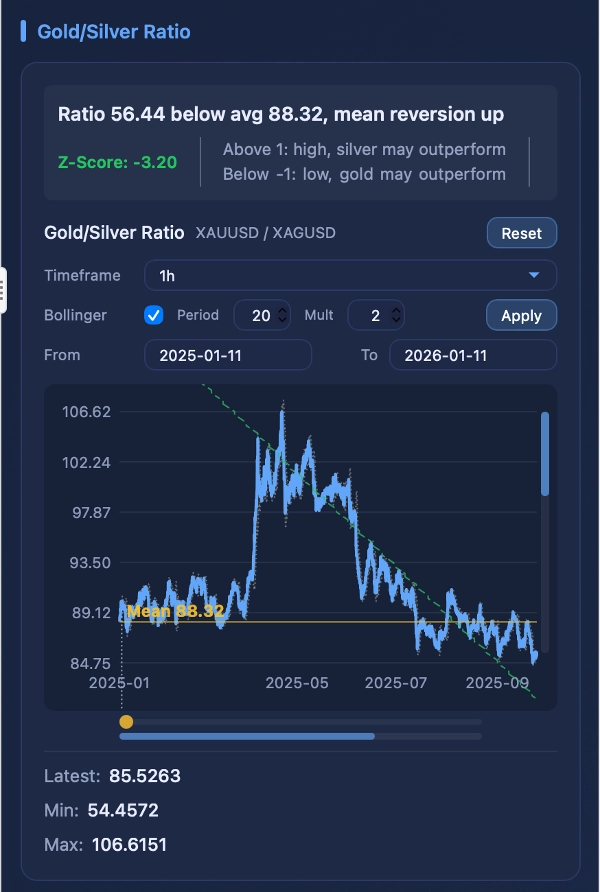
5. Gold/Silver Ratio Chart
Data Source: cTrader broker bars
The ratio (Gold/Silver) shows relative valuation.
Historical range: 40-90, mean ~65-70.
• Z > +1: Gold expensive vs silver → Silver may outperform
• Z < -1: Silver expensive vs gold → Gold may outperform
• Z ~ 0: Near historical average → No clear signal
Features: Interactive zoom/pan, timeframe selector (1m to Monthly),
custom date range, Bollinger Bands, Huber regression trend line,
Z-Score with color coding
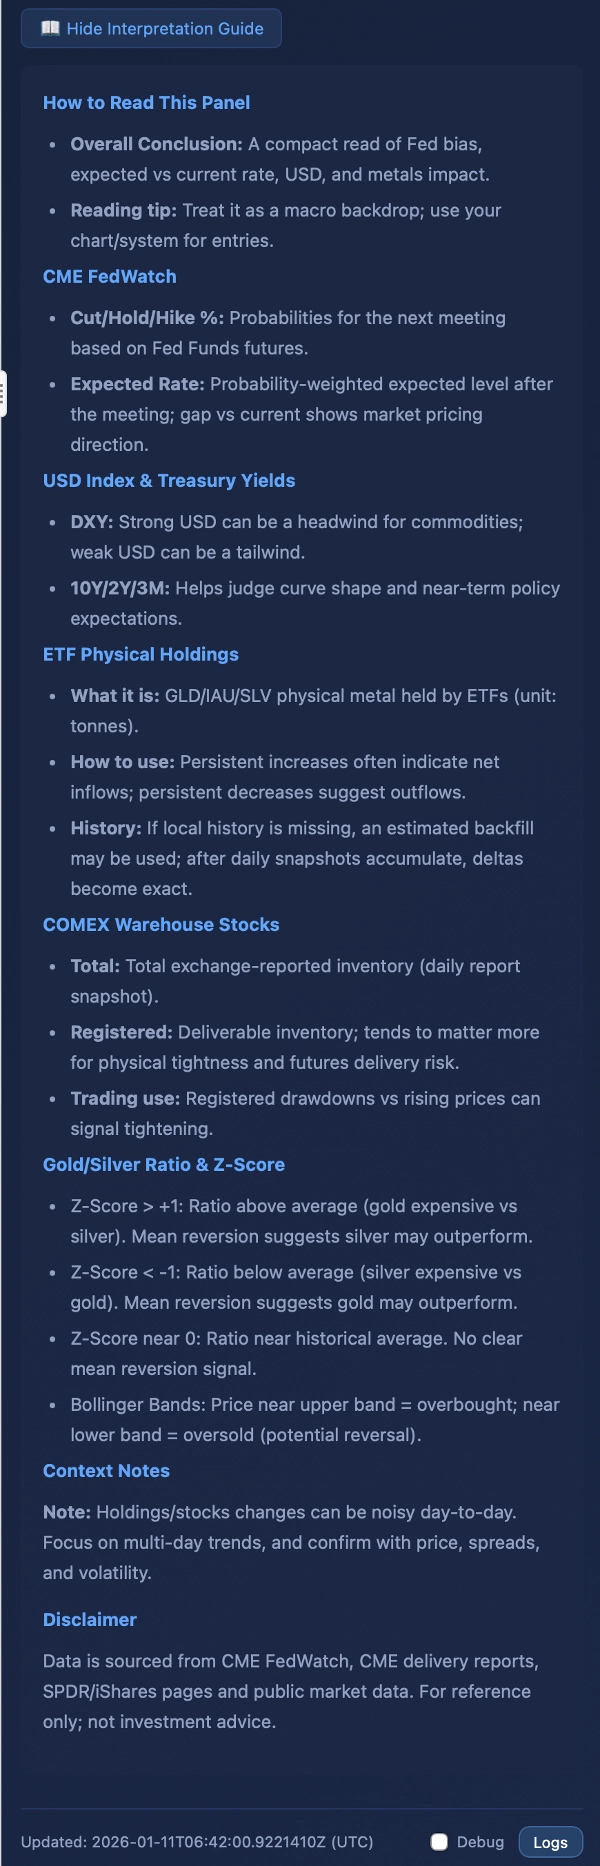
6. Interpretation Guide
Collapsible reference section explaining Fed policy bias,
probability interpretation, Z-score meaning, and Bollinger Bands usage.
PARAMETERS
──────────
UI: Language (Auto/English/Chinese)
System: Polling Seconds (default 120)
Rates: Daily Calibration (enabled), Calibration Time (21:10 UTC)
Symbols: Gold/Silver Symbol (AUTO or manual)
Chart: Timeframe (Daily), Lookback Bars (300)
DATA REFRESH INTERVALS
──────────────────────
CME FedWatch: 2 min
Yahoo Finance: 5 min
Investing.com: 15 min (fallback)
ETF Holdings: 1 hour
COMEX Stocks: 1 hour
DISCLAIMER
──────────
FedPulse is informational only. Not investment advice.
Conduct your own research before trading.
SUPPORT
───────
Questions or feedback? Contact the developer through cTrader marketplace.