
Description
This is not just another RSI robot with random settings and overfitted backtests.
When you buy this cBot, you also receive a full analytics package, built from large-scale quantitative testing. Over 1 Million parameter combinations tested across Japanese/Heiken Ashi/Renko Charts
How the strategy works
Long Entry
- A long signal triggers when RSI crosses upward through a defined level:
(Example: RSI Level was 29. Now it's 31. It crosses Level 30 upward. Here cBot open Long position)
Long Exit
- Take Profit (TP) — cross-back exit
Exit when RSI crosses down below the TP level. Example: RSI Level was 71. Now it's 69. It crosses Level 70 downward. Here cBot closes Long position.
- Protective Exit — cross-back exit (only if trade is in profit)
Exit when RSI crosses down below the Protect level, but only if the position is currently profitable.
- Stop Loss (SL) — RSI level stop (no cross required)
Exit immediately if RSI Level touches SL. Example: Enter Long position at RSI Level 30, SL is 25. When RSI touches 25, Long position will close.
Opposite for the Short Position
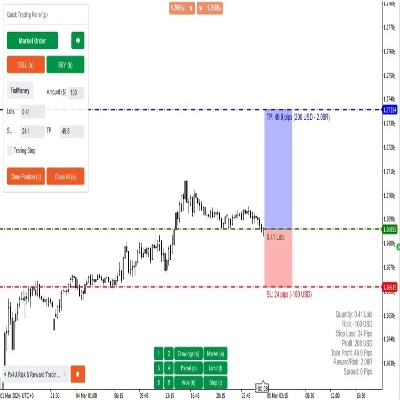
Position management
- The robot holds only one position at a time per symbol.
Signal timing
- Signals are evaluated only after a bar closes.
- If a signal appears, the entry is executed on the OPEN of the next bar (no intrabar guessing and we can properly evaluate strategy).
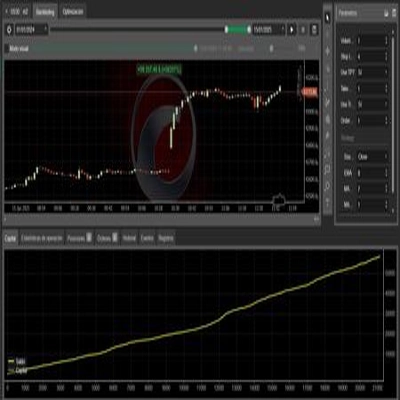
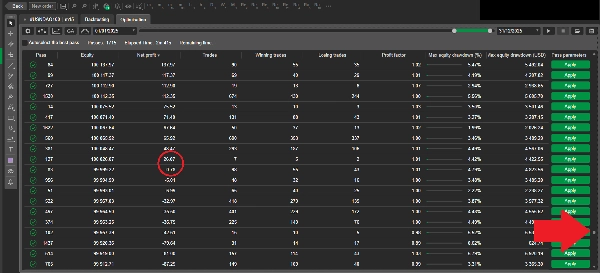
How I validate settings
I don’t “pick parameters by eye” or just random values. I test large parameter spaces using a genetic algorithm (GA):
- Thousands of parameter combinations are evaluated automatically
- Selection keeps diversity, not only the best performers (to reduce over-optimization risk)
- Testing is performed across multiple periods, timeframes, and chart types (Japanese / Heiken Ashi / Renko)
This produces a large dataset of results and helps identify stable parameter regions, not just one lucky configuration. After the first GA pass, I run a second optimization stage focused on the most stable and profitable parameter regions.
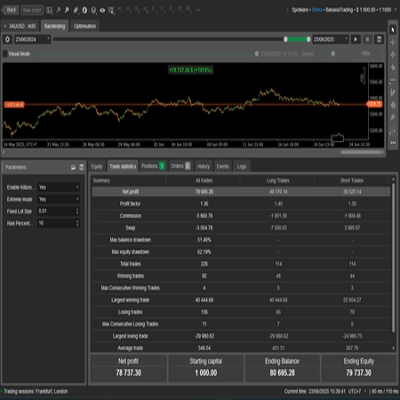
Metrics (brief list)
In the analytics I track, among others:
- Net Profit, Max Drawdown
- Profit Factor, Win Rate, Expected Value
- Sharpe, Sortino, Calmar
- MAE / MFE (excursions)
My GA results and cTrader backtests can differ slightly (and it’s normal)
When you compare my genetic-optimization (GA) results with a cTrader backtest, you may notice small differences in profit, entry/exit price, or a few derived metrics.
These differences are expected and come from two controlled factors:
1) Forced position close at the end of the test (no “open trades”)
My GA engine always closes any open position at the final bar of the test window. This prevents “stuck” or floating positions and makes results fully realized and comparable across runs.
In cTrader, depending on settings, a backtest may:
- leave a position open at the end, or
- close it differently (timing/price), or
- handle the final-bar execution with slightly different mechanics.
That alone can create a small difference in the final equity/profit.
2) Spread/slippage effects during volatility spikes
Real markets (and realistic simulations) can show occasional volatility spikes, where:
- spreads widen,
- slippage increases,
- execution prices differ slightly.
My GA model includes spread + optional slippage + commission, and in rare high-volatility segments this can shift fills by a small amount. Even a tiny price shift can slightly change metrics such as net profit, drawdown, profit factor and other
Despite these small execution-level differences, the strategy behavior and results are directly comparable:
- entries/exits follow the same logic,
- trades occur in the same areas,
- and the key performance metrics remain aligned.
If you want:
- full analytics package (T + interactive dashboard),
- recommended settings for your asset/timeframe,
- or custom research / strategy development,
Contact me via a link in my profile to receive Analytics
Risk disclaimer: This robot is for educational and research purposes. Trading involves risk, and past performance does not guarantee future results.
Summary
The robot manages one position per symbol at a time and evaluates signals only after bar close, executing trades at the next bar's open to avoid intrabar uncertainty. Parameter settings are optimized through extensive genetic algorithm testing, evaluating over one million parameter combinations across multiple periods, timeframes, and chart types to identify stable and profitable configurations. The package includes a full analytics suite tracking metrics such as net profit, max drawdown, profit factor, Sharpe ratio, and more.
Backtests use 100:1 leverage and market orders, with risk management via fixed lot sizing, take profit, and stop loss tools. Recommended minimum balance is $10,000 with 1% risk per trade and a maximum drawdown of 26.5%. The strategy targets low-frequency trades on instruments including BTCUSD, XAUUSD, NAS100, and indices.
Customer reviews
5 | 0 % | |
4 | 100 % | |
3 | 0 % | |
2 | 0 % | |
1 | 0 % |