Description
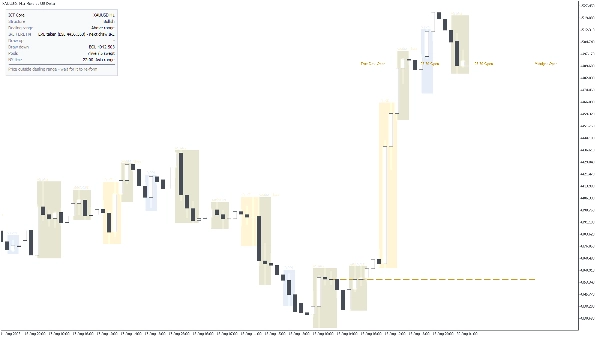
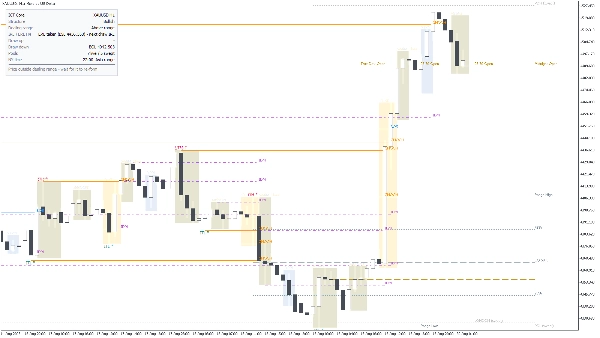
ICT Core turns a raw price chart into a structured Smart Money Concepts (ICT) read-out: market structure, liquidity pools, the dealing range, IRL / ERL state, New York sessions and killzones, plus a panel that states the current bias and the conditional plan in plain English. It draws only from closed, confirmed price action - once a level or label is printed it stays where it is.
WHAT IT ANALYSES
ICT Core reads bar data (open / high / low / close) from the chart symbol, plus one higher timeframe of your choice (default H4) for the IRL / ERL read. ATR is used to scale swing size, label spacing and the equal-high / equal-low tolerance, so the same settings behave consistently on XAUUSD, indices and FX. Session and killzone timing is calculated in New York time with automatic DST handling, not in fixed broker hours.
WHAT IT DRAWS AND HOW TO READ IT
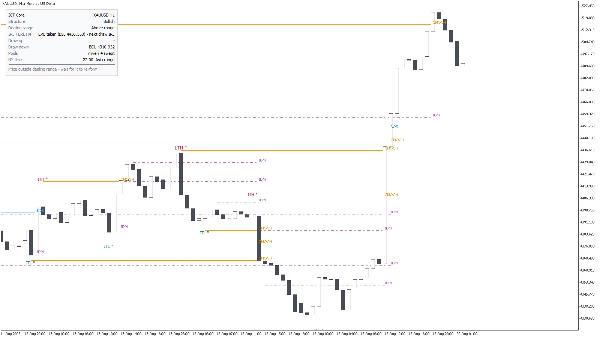
- Market structure. Swings are classified as short-term, intermediate-term and long-term. Breaks are labelled BOS (continuation) or CHOCH (change of character); a break made by wick only is tagged separately as a sweep, so you can tell a real displacement from a raid. Highs and lows that were taken by an impulsive leg are tagged strong / weak.
- Inducement (IDM). The minor high or low that price is likely to run before the real move is marked, so you can see the trap before it is sprung.
- Liquidity pools. Previous day, previous week, previous month, session highs and lows, and equal highs / equal lows are drawn as buy-side (BSL) and sell-side (SSL) levels. Once a pool is swept it is dimmed rather than deleted, so the history of what has already been taken stays readable.
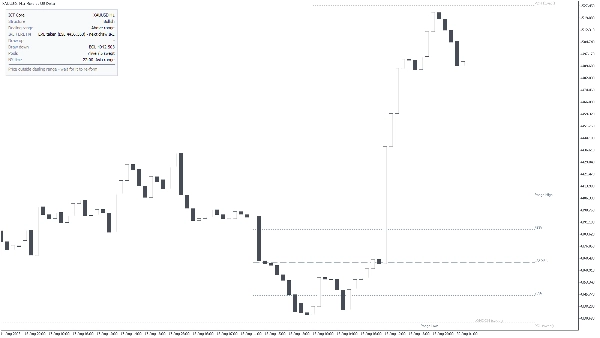
- Dealing range. The active range between the last valid high and low, with optional 25% / 75% quadrants for premium / discount reference.
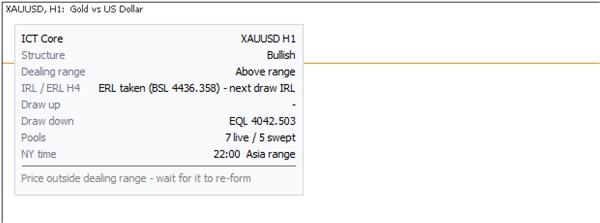
- IRL / ERL. The panel states whether external liquidity has been taken and the next draw is internal, or the other way round, read from the higher timeframe you select.
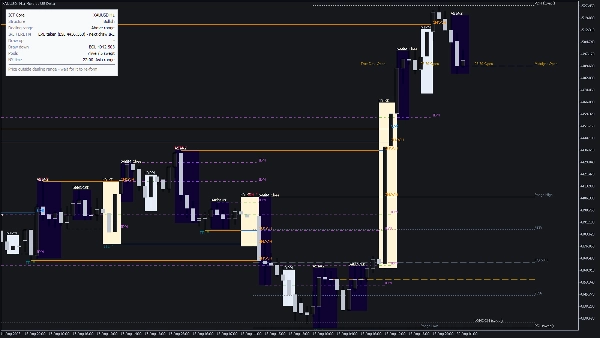
- Sessions and time. Asia, London, NY AM and NY PM boxes; London, New York and London-close killzones; silver bullet windows; optional 20-minute macros; and session opening price lines.
- Info panel. Symbol and timeframe, structure bias, where price sits in the dealing range, IRL / ERL state, the nearest draw above and below with its price, how many pools are live versus swept, New York time and the active session - plus a conditional plan line such as "Price outside dealing range - wait for it to re-form".
- Alerts. Popup, sound or email on a pool sweep, on BOS / CHOCH, and on killzone open.
KEY SETTINGS
- General: chart theme (auto / light / dark), bars to analyse (default 1500), label font size, and how far apart labels are staggered (in ATR).
- Market structure: swing strength in bars each side (default 2), which swing tiers to show, BOS / CHOCH on or off, wick-only breaks on or off, inducement on or off, and the impulse size in ATR that qualifies a high or low as strong (default 1.0).
- Liquidity pools: which pools to draw, equal high / low tolerance in ATR (default 0.15), how many days before a pool expires (default 20), and whether swept pools stay visible.
- Dealing range: range on or off, 25% / 75% quadrants on or off.
- IRL / ERL: source timeframe (default H4) and how many of its bars to scan (default 300).
- Sessions: session boxes, killzones, silver bullet, macros, opening prices, how many days back to draw (default 5), and box fill opacity.
- Panel: corner, X / Y offset, font size, whether to show the plan row, how many bars a sweep still counts as recent (default 12), and whether the plan requires an active killzone.
- Alerts and a full colour set for every element on the chart.
TYPICAL USE
1. Add ICT Core to an M5 - H1 chart of XAUUSD, an index or a major FX pair.
2. Read the panel top-down: bias, location in the dealing range, IRL / ERL, and the nearest draw above and below.
3. Wait for a liquidity pool to be swept inside a killzone, then look for CHOCH against the sweep on your entry timeframe.
4. Use the opposite draw shown in the panel as the target, and the swept extreme as invalidation.
5. Turn on sweep and BOS / CHOCH alerts if you do not want to watch the chart all session.
WHO IT IS FOR
Traders who already work with ICT / Smart Money Concepts and want the structure, liquidity and timing layers on one chart instead of drawing them by hand every day. It is aimed at intraday and short-swing discretionary traders. It is not a beginner's buy / sell arrow tool - you need to know what BOS, CHOCH, IDM, IRL and ERL mean in order to use it.
IMPORTANT LIMITATIONS AND USAGE NOTES
- ICT Core is an analysis and visualisation tool. It does not place orders, it does not give buy / sell signals, and the plan row is a conditional reminder, not a recommendation.
- Everything is derived from confirmed swings, so a structure point appears only after the required number of bars has closed on each side (default 2). Nothing is redrawn afterwards.
- Session and killzone times follow New York time including DST. Your chart is shown in broker server time, so the boxes will not line up with a fixed UTC offset - this is intended.
- The higher-timeframe IRL / ERL read needs enough history on that timeframe; on symbols with short history it is shown as unavailable.
- Analysis is limited to the bars-to-analyse window (default 1500). Increase it for more history, at the cost of a heavier first draw.
- Runs on cTrader Desktop for Windows and Mac. Custom indicators are not available on mobile or web.
- Trading involves risk. Past behaviour of any pattern does not guarantee future results. Always use your own risk management.
Summary
ICT Core highlights liquidity pools from previous days, weeks, months, and sessions, showing buy-side and sell-side levels, and dims swept pools to maintain historical context. It also delineates session times and killzones based on New York time with automatic daylight saving adjustments. An info panel provides a summary of current bias, price position within the dealing range, IRL/ERL status, nearest levels, live versus swept pools, and a conditional trading plan in plain English.
Users can customize settings including chart theme, swing parameters, liquidity pool visibility, session displays, and alert notifications for pool sweeps, BOS/CHOCH events, and killzone openings. ICT Core is intended for traders familiar with ICT/SMC concepts seeking an integrated, structured view of market dynamics for intraday and short-swing discretionary trading.









!["Gaussian Channel [Iridio Capital]" logo](https://cdn.ctrader.com/image/webp/2c4f9ca9-4e9b-476d-b5a6-787c8095032b_61546)