Description
ICCandle for cTrader
Find out what happened last time this chart looked like this — without leaving cTrader.
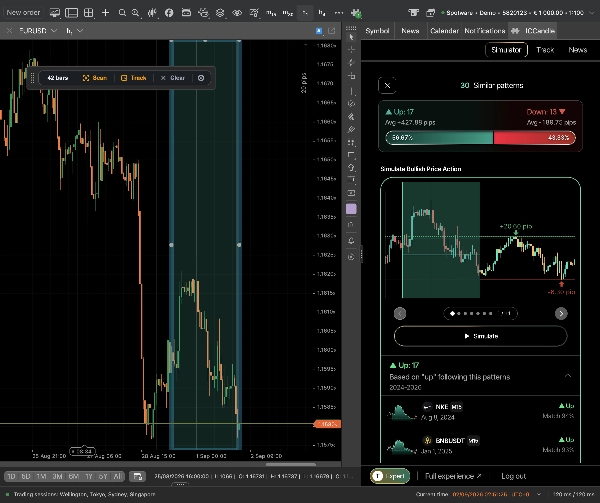
ICCandle is a pattern-search and news-reaction research plugin. Select a range of bars on your chart and ICCandle searches its historical index for the moments that looked most like it across 50 instruments. Matches come back in a panel docked inside cTrader, and whatever you click there is drawn onto your native chart: the matched pattern's bars, an animated projection of how price moved after those matches, and — on the news side — event lines with the real post-release high, low and pip reaction.
The research and the chart you trade from stay on the same screen.
What the plugin adds
Chart scanner toolbar — A small draggable card on the chart. *Select range* drops a resizable rectangle over recent bars that snaps to whole candles. Scan uploads exactly those candles and returns ranked historical matches. *Track* turns the same selection into a standing alert.
Ghost-candle replay — Pick a match and the plugin animates that match's *subsequent* candles forward from your current bar, one every 150 ms. The projection is rescaled to local volatility (median body size of the pattern against your last ~50 bars, anchored on the current close), so a match from a quiet 2019 session isn't drawn at 2019's amplitude on today's chart. If the projection won't fit, the chart zooms out first, then plays.
Economic-news overlays — The News view draws vertical event lines with currency labels. Click an already-released event and you get post-event impact boxes on the chart: high, low, mid, and the move in pips. Click an upcoming one and the surrounding bars are handed to the panel for context.
Pattern tracker — Save the selected shape as a monitored alert across chosen symbols, timeframes and a session window, so it finds you instead of you hunting for it.
Pattern overlays — Any pattern you select in the panel, classic or custom, is highlighted on the native chart, locked so it can't be dragged out of place.
How it fits your workflow
It sits before the order ticket, in the "is this setup worth taking" step.
1. Enable ICCandleEmbed under Algo → Plugins, then click the ICCandle button on the chart toolbar. The panel opens on the right; the scanner toolbar appears on the chart.
2. Sign in once inside the panel. The session persists, so restarts skip this.
3. You spot a formation. Draw the range over it and hit Scan.
4. Read the ranked matches, click through them, and watch each one's aftermath play out on your live chart at your own volatility.
5. Act on it in the normal cTrader ticket, or hit Track and let it alert you next time.
Around news the flow inverts: open the News tab, see what's scheduled, then click a past instance of the same release to see how far it actually moved this pair.
Panel and chart stay in sync automatically. Switching tabs in the panel shows or hides the scanner and clears overlays that no longer apply, and the panel always knows your chart's current timeframe.
Typical use cases
Confirming a discretionary setup. You see a double bottom on EURUSD 1H. Scan it. Thirty historical lookalikes that mostly resolved upward is a very different trade from a 50/50 split. The replay shows the shape and scale of the typical aftermath, not just a win rate.
Sizing a news trade. Before NFP or a CPI print, pull up past releases and read the impact boxes: this pair typically travels N pips inside the reaction window. That's a stop-distance and target input, not a direction call.
Judging whether a breakout has legs. Select the consolidation plus the breakout bar and scan. Matches that immediately retraced tell you something the chart alone doesn't.
Cross-market pattern hunting. Set symbols to your whole watchlist instead of the current chart and let the scan find whichever instrument is forming the shape you like.
Passive monitoring. Any pattern you trade repeatedly goes into the tracker with your session window attached.
Who it's for
Best suited to discretionary and semi-systematic traders at intermediate level or above — traders who already read price action, already have a setup they trade, and want historical base rates for it rather than a signal to follow blindly.
Particularly good for:
- Price-action and pattern traders on forex, gold, indices or crypto
- News and event traders who need reaction-size data rather than forecasts
- Intraday to swing horizons, 15M through daily
- Anyone who does manual "let me scroll back and find similar setups" research — this replaces hours of it
Less suitable for: beginners who haven't yet formed a strategy to test, scalpers working below 15 minutes, and traders looking for fully automated execution.
Limitations and usage notes
- It does not trade. No orders are placed, no positions modified, no account data read. Analysis and visualisation only — every execution decision stays yours.
- An ICCandle account and an internet connection are required. The panel, the pattern index and the news data are all served from ICCandle's backend.
- Scans need 15-minute resolution or higher. The index carries nothing below 15M, so the scanner defaults to 15M regardless of your chart's timeframe.
- Only the 50 indexed instruments can be scanned or tracked. Your broker offers more; symbols outside the catalogue are filtered out of the pickers rather than silently returning zero matches.
- Selection size is enforced: 10–100 bars, multiples of 10 above 50.
- Plan gating. Match count and model depend on your ICCandle subscription — Free 30, Standard 50, Pro 100, Expert 200 matches; the Standard, Plus and Pro models require a Pro or Expert plan. Options above your plan stay visible with an upgrade hint. A failed plan lookup is treated as Free.
- Ghost candles are historical analogues, not forecasts. They show how price behaved after similar-looking bars in the past, rescaled to today's volatility. Similar shapes are not the same context — regime, spread, session and upcoming events all differ. Treat them as one input alongside your own analysis, never as a prediction.
- One panel per instance. Clicking the toolbar button rebuilds the panel from scratch, and closing it clears every overlay it drew.
- Requires Full Access rights, because the plugin makes outbound HTTPS calls to ICCandle's services.
- cTrader Desktop on macOS and Windows.
- News sessions use their home-market clocks (New York 09:30–16:00 ET, London 08:00–16:30 UK, Tokyo 09:00–15:00 JST, Sydney 10:00–16:00 AEST). Custom windows are sent with the timezone you specify, so nothing is silently converted.
Summary
Key features include:
- A chart scanner toolbar for selecting bar ranges and scanning historical matches or setting alerts.
- Ghost-candle replay that animates the price movement following matched patterns, scaled to current market volatility.
- Economic-news overlays displaying event lines with post-release price impact metrics.
- Pattern tracking to monitor specific shapes across symbols, timeframes, and session windows.
- Pattern overlays that highlight selected matches on the chart without altering their position.
The plugin integrates seamlessly into the trader’s workflow, providing historical context before order execution. It supports 15-minute resolution or higher and requires an ICCandle account with internet access. ICCandlePlugin operates solely as an analytical tool without placing trades or accessing account data. It is suitable for intermediate or advanced traders focusing on price action, pattern recognition, and news reaction across forex, gold, indices, and crypto markets.


!["Custom Timeframes [Iridio Capital]" logo](https://cdn.ctrader.com/image/webp/4d75a920-23c7-4fea-a7b5-594a9d067f2e_63286)