present
Sign up and get $50 off your first purchase
Trading product for Helix Volume Profile Indicator Key Levels Volume, image 1
Helix Volume Profile
Indicator
Version 1.0, Sep 2026
Windows, Mac
Trading product for Helix Volume Profile Indicator Key Levels Volume, image 2
Trading product for Helix Volume Profile Indicator Key Levels Volume, image 3
Trading product for Helix Volume Profile Indicator Key Levels Volume, image 4
Trading product for Helix Volume Profile Indicator Key Levels Volume, image 5
Trading product for Helix Volume Profile Indicator Key Levels Volume, image 6
Trading product for Helix Volume Profile Indicator Key Levels Volume, image 7
Trading product for Helix Volume Profile Indicator Key Levels Volume, image 8
Trading product for Helix Volume Profile Indicator Key Levels Volume, image 9
Trading product for Helix Volume Profile Indicator Key Levels Volume, image 10
Trading product for Helix Volume Profile Indicator Key Levels Volume, image 11

Description

Helix Volume Profile builds a complete picture of the higher-timeframe session that the current chart sits inside.

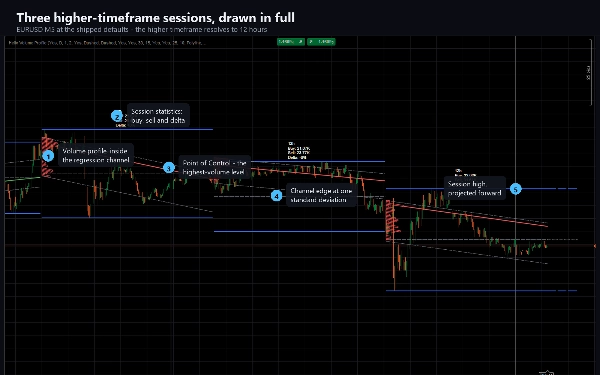
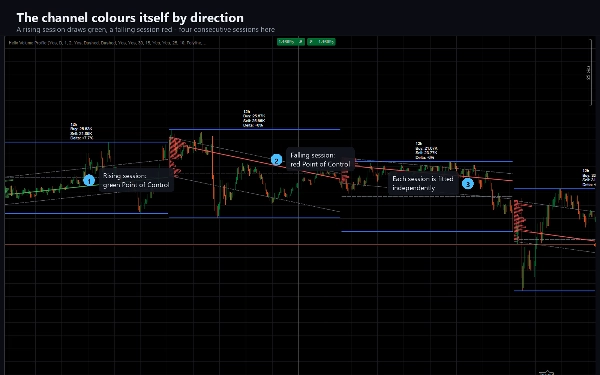
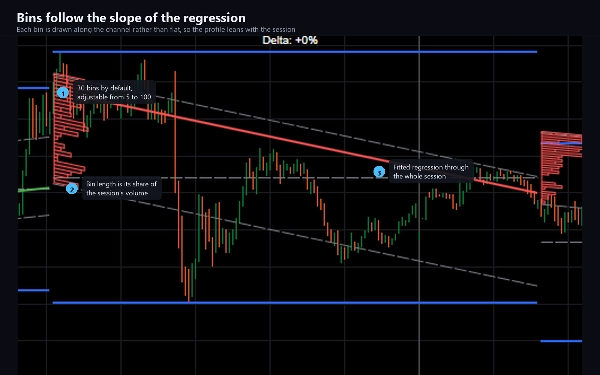
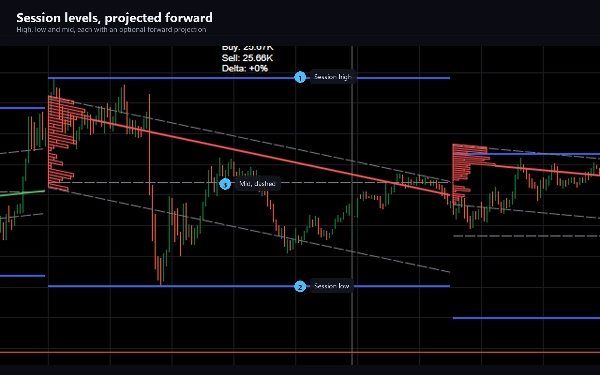
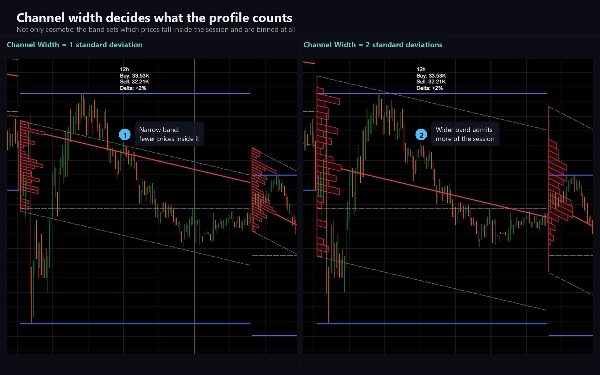
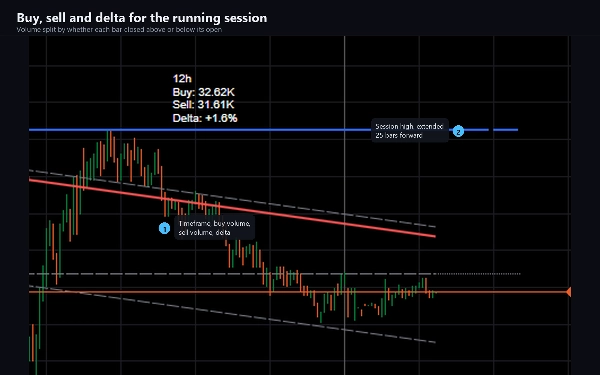
For each session it fits a logarithmic regression across every bar so far, draws a channel a configurable number of standard deviations wide around it, and fills that channel with a volume profile whose bins follow the slope of the regression rather than sitting flat. The highest-volume bin is marked with a Point of Control line, coloured to the direction the channel is travelling. The session's high, low and mid levels are drawn alongside and can be projected forward, and a compact label reports buy volume, sell volume and the delta between them.

The higher timeframe is chosen for you by default and adapts to the chart: a 12-hour session on M5, four hours on M1, two days on M15, a week on H1, a month on H4. You can switch that off and set the session yourself - minutes, days, weeks or months are all accepted.

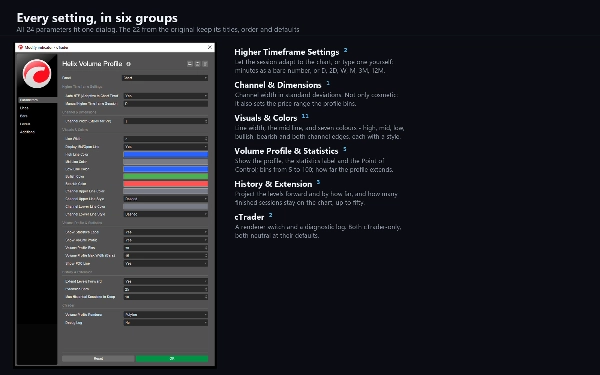
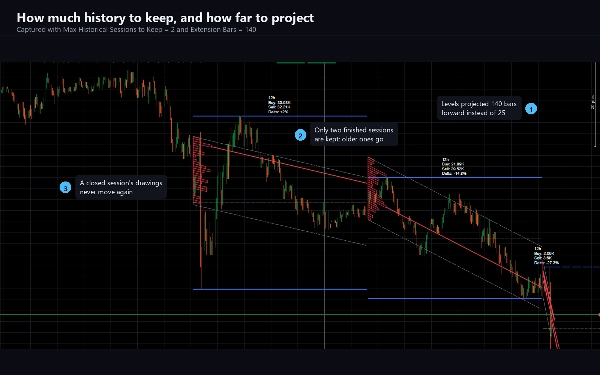
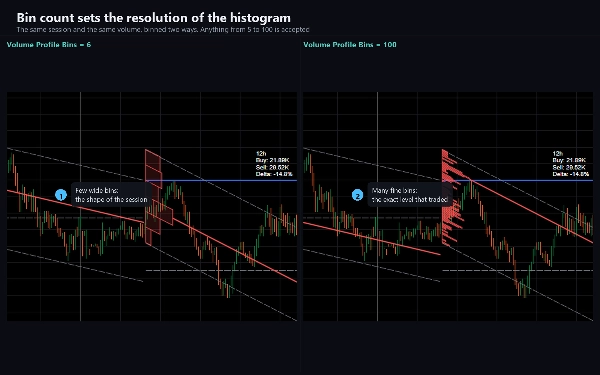
Everything is adjustable. Channel width, the number of profile bins from 5 to 100, how far the profile extends, whether the Point of Control, the statistics label and the forward projections are shown, the line widths and styles, seven colours, and how many finished sessions stay on the chart, up to fifty.

WHAT IT IS FOR

Reading where price sits inside its higher-timeframe structure without leaving your working timeframe. The channel shows the session's drift and dispersion; the profile shows where volume actually accumulated inside it; the Point of Control marks the level that saw the most activity. Traders use these to frame support and resistance, to judge whether a move is stretched relative to the session, and to see whether buying or selling dominated.

Suitable for any instrument and any timeframe. It is most informative on intraday charts from M1 to H4, where the adaptive session gives a meaningful window; on Daily and higher, set the session manually.

HOW IT BEHAVES

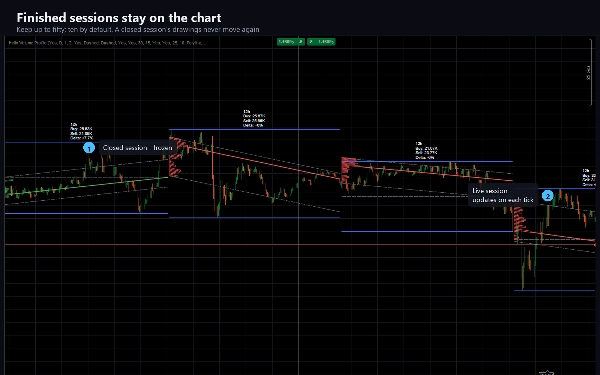
The live session updates on every tick and its drawings move until the session closes - the channel is refitted, the profile rebuilt and the levels re-measured as each bar arrives. Once a session ends its drawings are frozen and never change again. This is deliberate and it is how the method works; if you need levels that never move intrabar, read a closed session rather than the live one.

Volume on a forex symbol is the tick count your broker reports, so the profile reflects your own feed.

TECHNICAL

Indicator, overlay. 24 parameters. No trading permissions, no file access and no network access - it is built with AccessRights set to None and cannot place an order. Includes a trial edition restricted to EURUSD with no time limit and no disabled features.

Documentation covers installation, every parameter with its purpose, and a troubleshooting guide that explains each behaviour that surprises people.

Trading involves risk. Past performance does not guarantee future results.

Summary

Indicator profile
Indicator category
Trend
Output type
Visualisation
Data requirements
Volume

Customer reviews

0.0
Reviews: 0
Customer reviews
No reviews for this product yet. Already tried it? Be the first to tell others!

Discussion

FAQ

Key Levels
Volume
Market Structure
Channel
Support & Resistance
Products available through cTrader Store, including trading bots, indicators and plugins, are provided by third-party developers and made available for informational and technical access purposes only. cTrader Store is not a broker and does not provide investment advice, personal recommendations or any guarantee of future performance.

More from this author

Indicator
ATR
BOS
+5
Know how strong each Supertrend flip is: scored BUY/SELL, structure stop + 3 targets, live win-rate dashboard, alerts.
Indicator
ADX
ATR
+5
Scored breakouts of sloped pivot trendlines: four filters on the break bar, ATR stop, 1:1 / 1:2 / 1:3 targets, alerts.
Indicator
ATR
RSI
+5
Supply and demand zones with break of structure, higher timeframe MA signals, a percent stop and three targets.
Indicator
ATR
Volume
+3
Fibonacci trend signals on closed bars, with an ATR stop, up to four targets and a break-even ladder.
Indicator
ADX
ATR
+5
Ten confluence layers scored on every closed bar, with an anti-chop gate, pivot levels and a live dashboard.
Indicator
Volume
Key Levels
+1
Fixed-grid volume profile: bull and bear volume at every price level, with Point of Control and value area.
Indicator
ADX
ATR
+5
SuperTrend signals scored on five confluence factors, with an ATR stop, three targets and a dashboard.

You may also like

Indicator
AI
SMC
+4
Weekly Daily Opening Gaps β€” NWOG & NDOG Indicator Professional-grade opening gap visualization for institutional traders
Indicator
ATR
SMC
+17
Adaptive Swing-Anchored VWAP that tracks market structure shifts with precision and clarity.
Indicator
Key Levels
Order Block
+5
Pixel-perfect trading zones in a click! Instantly draw, resize & color via hotkeys. Automate your charting routine
Indicator
XAUUSD
Professional Volume Profile Indicator - Shows volume distribution, POC, Value Areas & Buy/Sell pressure.
Indicator
ATR
MSS
+5
Grades ICT Unicorn setups (Breaker Block + FVG confluence) into PRIME / SETUP / WATCH, with retest & RR targets.
Indicator
AI
Grid
+10
Crossover Buy and Sell Alerts and signals
Indicator
ATR
Channel
Reversal Trap Probability Bands plots a dynamic volatility envelope around price & automatically detects "trap" reversal
Indicator
Pin Bar
Inside Bar
+2
Advanced candlestick pattern recognition with structural quality scoring, alerts and adaptive chart visuals.
Indicator
Laguerre RSI: smoother, faster RSI with less noise. Great for spotting reversals and timing entries.
Indicator
Forex
EURUSD
+3
Forex Strength Meter for cTrader: 4 custom currencies, cross alerts, visual arrows. Trade smarter!
Indicator
Indices
Commodities
The Advanced CCI & EMA Indicator combines the CCI with 40 & 80 EMA logic to generate precise arrows signaling direction
Indicator
It draws a step line that visualize the movement of H4. Particularly effective when trade on lower timeframe.
Indicator
ATR
Key Levels
It combines the trend-filtering power of Renko charts with the volatility tracking of ATR Bands
Indicator
SMC
Forex
+5
ICT liquidity engine for Gold: maps stop clusters, scores zones & projects the next target. Now with 4 ICT killzones.
Indicator
ATR
EMA
+3
The UTBot you know from TradingView Ҁ” now on cTrader with confirmed signals, VWAP, EMA and session overlays.
Indicator
RSI
Forex
+6
πŸš€ QQEX Trinity Indicator - The Ultimate Trading Filter πŸš€
Indicator
SMC
Prop
+15
Previous HLOC – Smart Higher-Timeframe Levels for Precision Trading.
Indicator
Volume
Fibonacci
+3
Draw and manage multiple fixed-range volume profiles with persistent levels, developing POC/VA and smart alerts.

Price