
Descrição
- O que faz (seu valor).
- Como ajuda os traders.
- O que o torna único.
- Como usá-lo (breve).
- O que a versão paga desbloqueará (dica).
🔸
Indicador Session Golden Hours
(Versão Gratuita)
Descrição
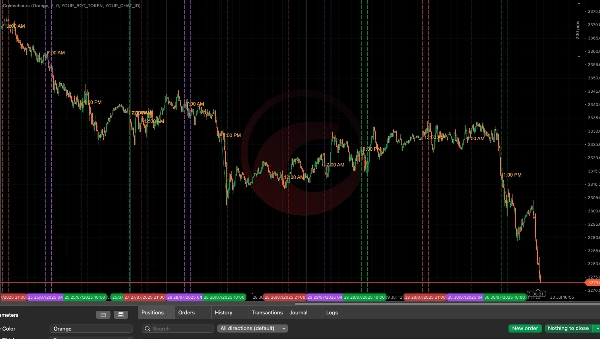
O indicador Session Golden Hours é projetado para traders sérios que desejam visualizar janelas de negociação de alta probabilidade com base em padrões de liquidez por sessão. Esta ferramenta destaca automaticamente períodos-chave nas sessões da Ásia, Londres e Nova York — frequentemente chamadas de “horas douradas” do mercado — quando o preço tem maior probabilidade de romper a faixa e revelar a intenção institucional.
O que faz:
- Rastreia máximas/mínimas da sessão da Ásia (00:00–08:00 UTC) para mapear zonas de liquidez.
- Destaca as horas-chave de Londres e Nova York tais como:
-
- Pré-fechamento de Londres (06:00–07:00 UTC)
- Hora de fechamento de Londres (07:00–08:00 UTC)
- Zona de varredura da tarde em NY (13:00–14:00 UTC)
- Desenha guias visuais no seu gráfico para ancorar sua atenção nas horas diárias de rompimento.
Como isso ajuda você:
- Identifique facilmente zonas de varredura de liquidez durante sobreposições de sessões.
- Concentre suas decisões de negociação em períodos de tempo do dinheiro inteligente — nada mais de negociar em zonas mortas.
- Reconheça visualmente onde tendem a ocorrer falsos rompimentos e reversões.
- Funciona em qualquer instrumento e qualquer período de tempo que siga ciclos globais de sessão.
Principais Características:
- Cor da linha, espessura e extensões de tempo ajustáveis.
- Rastreamento automático da sessão sem necessidade de plotagem manual.
- Suporte incorporado para os 15 dias de negociação recentes.
- Visuais limpos e não intrusivos no gráfico.
Ideal para:
- Traders estilo ICT (modelos de liquidez + tempo)
- Scalpers de price action
- Traders que usam confluências baseadas em tempo
🔓 Quer mais?
A Versão Pro (Em Breve) adiciona:
- Alertas de rompimento em tempo real enviados diretamente para Telegram
- Lógica para falsos rompimentos na Ásia → reversões em Londres e máximas/mínimas de Londres → reversões em NY
- Temporizador inteligente para evitar excesso de alertas
- Rastreamento completo de máximas/mínimas baseadas na sessão com rotulagem de sinais
- Roteiro futuro: alertas FVG, zonas internas de liquidez e filtragem de sinais
Resumo
Avaliações de clientes
5 | 0 % | |
4 | 100 % | |
3 | 0 % | |
2 | 0 % | |
1 | 0 % |


