
ADX and ADI
Indicador
258 transferências
Versão 1.0, Aug 2025
Windows, Mac
5.0
Avaliações: 2
Descrição
Principais Características:
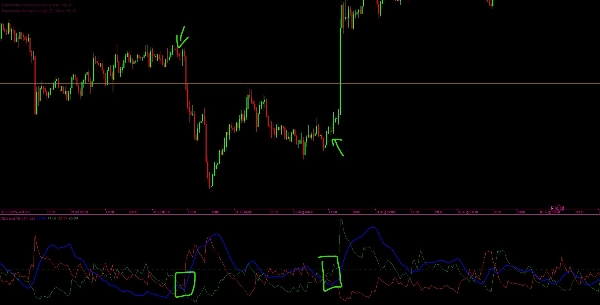
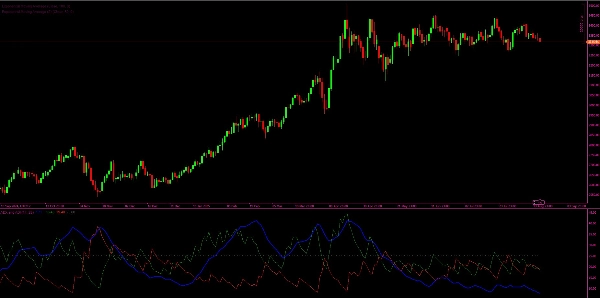
- Linha ADX e ADI (Azul): Mostra a força suavizada da tendência atual, independentemente da direção.
- Linha +DI (Verde): Indica a força dos movimentos ascendentes.
- Linha -DI (Vermelha): Indica a força dos movimentos descendentes.
- Linha de Limite (Cinza): Um nível de referência horizontal (padrão 25) para ajudar a identificar se a força da tendência é significativa.
Como Funciona:
- O indicador calcula True Range (TR), Movimento Direcional Positivo (+DM), e Movimento Direcional Negativo (-DM).
- Aplica a técnica de suavização de Wilder para calcular os valores suavizados de TR, +DM e -DM.
- A partir destes, os Indicadores Direcionais (+DI e -DI) são derivados, mostrando qual lado (altista ou baixista) tem maior momentum.
- O DX (Índice Direcional) é calculado a partir da diferença relativa entre +DI e -DI.
- Finalmente, o ADX (Índice Direcional Médio) é calculado como uma versão suavizada do DX, fornecendo uma medida da força geral da tendência.
Interpretação:
- Quando o ADX está acima do limite (ex.: 25), o mercado é considerado em forte tendência.
- Quando +DI > -DI, os touros estão no controle (tendência de alta).
- Quando -DI > +DI, os ursos estão no controle (tendência de baixa).
- Quando o ADX está abaixo do limite, o mercado é considerado em consolidação (tendência fraca ou inexistente).
Resumo
Resumo de IA
This custom indicator provides a full implementation of the Average Directional Index (ADX) and Directional Indicators (DI) to measure trend strength and direction in financial markets. It displays four key lines: the ADX and ADI line (blue) representing smoothed trend strength regardless of direction; the +DI line (green) indicating upward movement strength; the -DI line (red) indicating downward movement strength; and a threshold line (gray, default 25) to identify significant trend strength.
The indicator calculates True Range (TR), Positive Directional Movement (+DM), and Negative Directional Movement (-DM), applying Wilder’s smoothing technique to derive smoothed values. From these, it computes the +DI and -DI lines to show bullish or bearish momentum. The Directional Index (DX) is calculated from the relative difference between +DI and -DI, and the ADX is a smoothed version of DX, quantifying overall trend strength.
Interpretation guidelines include: ADX above the threshold signals a strong trend; +DI greater than -DI indicates bullish control; -DI greater than +DI indicates bearish control; and ADX below the threshold suggests a ranging or weak trend market.
Perfil do indicador
Avaliações de clientes
5.0
Avaliações: 2
5 | 100 % | |
4 | 0 % | |
3 | 0 % | |
2 | 0 % | |
1 | 0 % |
Avaliações de clientes
December 1, 2025
ADX and ADI delivers clean trend strength and direction signals. ADX shows when the market is actually trending, while +DI and -DI reveal who’s in control. Stable, lightweight and reliable across all timeframes. Best on H1+ for smoother signals. Alerts and zone-highlighting would be great additions.
September 12, 2025
Conversa
Perguntas frequentes
Os produtos disponíveis através da cTrader Store, incluindo bots de negociação, indicadores e plugins, são fornecidos por programadores terceiros e são disponibilizados apenas para fins informativos e de acesso técnico. A cTrader Store não é um corretor e não fornece aconselhamento em matéria de investimento, recomendações pessoais ou qualquer garantia de desempenho no futuro.


Preço
Desde 21/02/2025
466.3M
Volume negociado
180.83K
Pips ganhos
22
Vendas
6.89K
Instalações gratuitas