
説明
🚀 10,000人以上のトレーダーがすでに私たちのTOP インジケーター🏆
👉 すべてのTOPシステムはこちらから入手:
_______________________________________________
📌 マーケット構造インジケーター
· ✅ AdvancedMarket Structure: Bos, Choch, SwinLevels, Order Blocks, Market Structure& Liquidity Finder
· 🔄 Dynamic Market StructureAnalysis of Turning Points
· 🧱 Order Block
· ⚖️ Market Imbalance
· ⛓️ BOS & CHOCH
· 🧠 ICT Power of 3
_______________________________________________
🔚 スマートエグジットシステム
· 📍 トレーリングスマートアルゴリズム
_______________________________________________
📐 ジグザグインジケーター
· 🔍 ジグザグ価格流動性予測
· 🧭 S&R構造的ジグザグ
· ➖ ジグザグ
· 🎯 ジグザグ極端トラッカー
_______________________________________________
🧱 サポート&レジスタンスインジケーター
_______________________________________________
📊 トレンド&チャネルインジケーター
· 🔄 オートトレンドチャネル
· 📊 スーパートレンド
· 🧠 アダプティブトレンドチャネル
· 💥 チャネルブレイクアウトシステム
· ⭐ プレミアムSSLチャネル
· 🔁 リアクティブ移動平均
_______________________________________________
💧 ボリューム&流動性ツール
· 🔥 ボリュームPOCヒートマップ
· 📉 レバレッジ清算マップ
· 🔍 モメンタムフェアバリューギャップ
· 🕒 フェアバリューギャップセッション
_______________________________________________
⚡ モメンタム&RSIインジケーター
· 📈 RSIトレンドトリガー
· 🚀 ダイナミックレンジモメンタム
_______________________________________________
🔮 予測&投影ツール
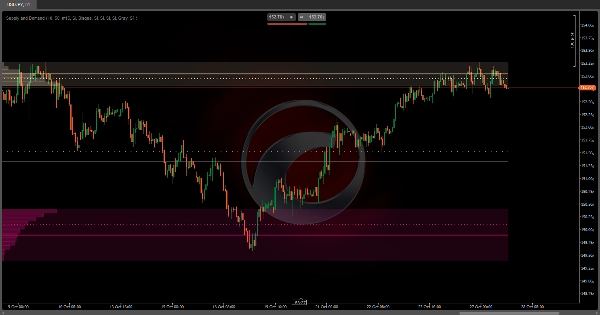
オートサプライ&デマンド: 💹
オートサプライ&デマンドは、高度なボリューム分析インジケーターで、チャート上の最も取引活動が活発なゾーンを自動的に特定します。📊 他の静的なインジケーターとは異なり、このインジケーターは観察している視覚範囲に動的に適応し、ズームやスクロールのたびにゾーンを再計算します。
どのように機能しますか? ❓
アルゴリズムは、表示されている価格範囲を複数の水平レベル(2から500の分割で設定可能)に分割し、各レベルで取引されたボリュームを分析します。より高い精度を得るために、観察しているタイムフレームよりも低いタイムフレームのデータを使用します。🕒 例えば、1時間チャートを見ている場合、15分足のキャンドルを分析して、実際にボリュームが集中していた場所をより詳細に検出できます。
識別プロセス 🔍
インジケーターは極端な部分から中央に向かって動作します:
- 最高価格から: 🚀 表示範囲の高値から始まり、レベルごとに下降し、各価格帯で取引されたボリュームを累積します。
- 最低価格から: 📉 同時に安値から上昇し、上向きにボリュームを累積します。
- アクティベーション閾値: ⚡ これらのゾーンのいずれかが総ボリュームの特定の割合(設定可能でデフォルトは10%)を累積すると、重要なゾーンとしてマークされ、その方向の探索は停止します。
- 中間ゾーン: ⚖️ 上下の両ゾーンが特定されると、中間の空間は中立またはバランスゾーンとしてマークされます。
何のために使うのですか? 🎯
このインジケーターはマーケット構造分析ツールで、以下のことを支援します:
- 特定する 供給ゾーン: 🏔️ 歴史的に売り圧力が高かった上部エリア。
- 特定する 需要ゾーン: 🏖️ 買い圧力が集中していた下部エリア。
- 検出する バランスゾーン: 🎭 買いと売りの圧力が均衡している中間範囲。
これらのゾーンは、多くの参加者がポジションを取ったレベルであるため、将来的に価格の磁石のように作用する傾向があります。🧲
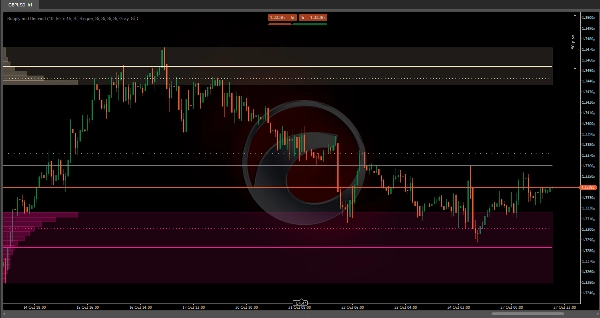
どのように組み合わせることができますか? 🔗
プライスアクション戦略と:
- 特定されたゾーンの 再テスト を待ち、反転の確認を探します。
- ゾーンを 利益確定のターゲット または ストップロスの配置として使用します。
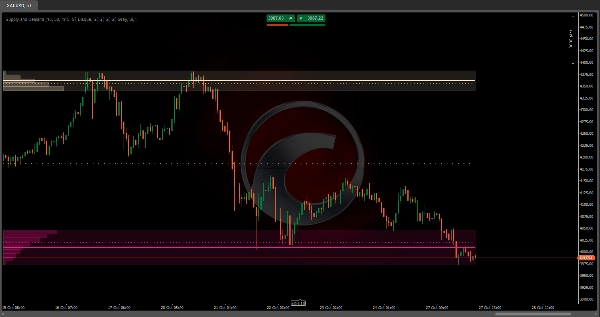
トレンドインジケーターと:
- 上昇トレンドの中で、価格が下部の 需要ゾーンを再テストするときにエントリーを探します。📈
- 下降トレンドの中で、上部の 供給ゾーンをレジスタンスとして売りに利用します。📉
マルチタイムフレーム分析と:
- 上位タイムフレームでゾーンを特定し、下位タイムフレームで確認を探します。
- 上位タイムフレームのゾーンは、下位タイムフレームで複数のゾーンを含むことがあります。
モメンタムインジケーターと:
- RSIやストキャスティクスと組み合わせて、ゾーン内の買われ過ぎ/売られ過ぎの状態を確認します。
- ダイバージェンス が供給/需要ゾーンで潜在的な反転を示すことがあります。
カスタマイズ可能な設定 ⚙️
インジケーターは各ゾーンを独立して完全に調整できます:
- 各視覚要素(エリア、平均線、加重線)の有効化/無効化。
- ボリューム閾値: ゾーンを重要とみなすために累積すべき総ボリュームの割合。
- 価格分割数: 数値が大きいほど精度が高くなりますが、計算量も増えます。
- 低タイムフレーム: ボリューム分析の粒度を定義します。
主な特徴:自動適応 🔄
表示に基づく自動再計算。 これは以下を意味します:
- もしあなたが ズームイン してセッションの詳細を見る場合、その時間帯の特定の供給と需要ゾーンを識別します。
- もしあなたが ズームアウト して週や月を見る場合、全期間のマクロゾーンを再計算します。
- チャートを スクロール するたびに、表示範囲のコンテキストを反映するようにゾーンが更新されます。
概要
The indicator divides the visible price range into configurable horizontal levels (2 to 500 divisions) and analyzes volume traded at each level using data from a lower timeframe than the chart’s timeframe for enhanced accuracy. It identifies significant zones by accumulating volume from the highest and lowest visible prices until a configurable volume threshold (default 10%) is reached, marking these as supply and demand zones respectively. The area between these zones is designated as a balance zone, representing equilibrium between buying and selling pressures.
These zones highlight areas of historically high trading activity that often act as future price magnets. The indicator supports customization of visual elements, volume thresholds, price divisions, and analysis timeframe. It can be combined with price action strategies, trend indicators, multiple timeframe analysis, and momentum indicators like RSI or Stochastic to improve trade entries, exits, and confirmations.
Supported markets include Forex, Indices, Commodities, Stocks, and Cryptocurrencies, with symbols such as EURUSD, GBPUSD, BTCUSD, XAUUSD, and NAS100.
カスタマーレビュー
5 | 50 % | |
4 | 0 % | |
3 | 0 % | |
2 | 0 % | |
1 | 50 % |


