
Açıklama
Kontrol Noktası (POC), belirli bir dönem içinde en fazla işlem hacminin gerçekleştiği hacim profili grafiğinde bir fiyat seviyesidir. Bu seviye, büyük işlem kurumlarının en aktif olduğu ve piyasa fiyatının uzlaştığı bir fiyatı temsil ettiği için önemli bir destek veya direnç bölgesi olarak işlev görür. Tüccarlar, POC'yi ana fiyat bölgelerini belirlemek, piyasa duyarlılığını ölçmek ve potansiyel fiyat hareketlerini ve dönüşlerini tahmin etmek için kullanır.
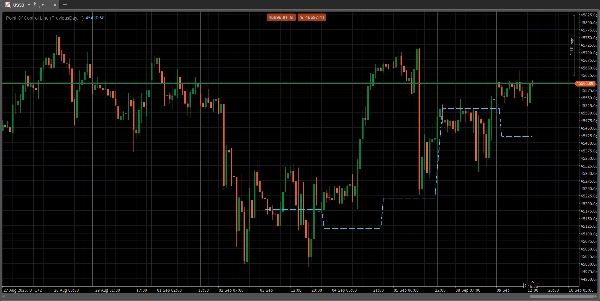
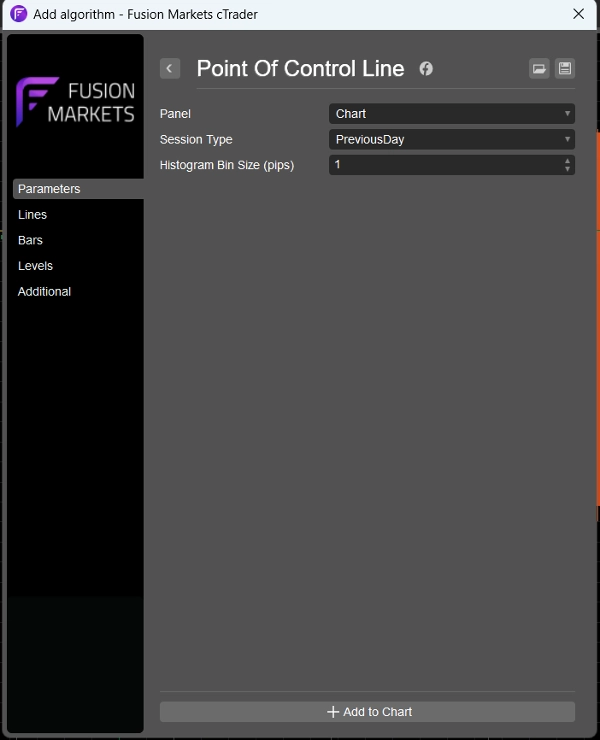
Sadece çizgiye ihtiyaç duyanlar için alışılmış hacim profili göstergelerindeki tüm gürültüyü kaldırdım ve sadece POC çizgisini bıraktım. Önceki gün, 4 saatlik veya 1 saatlik hacim profili için POC çizgisini görüntülemek üzere bir parametre ekledim, böylece farklı zaman dilimlerinde işlem yapan tüccarlar için uygundur.
Özet
Müşteri değerlendirmeleri
5 | 100 % | |
4 | 0 % | |
3 | 0 % | |
2 | 0 % | |
1 | 0 % |


