
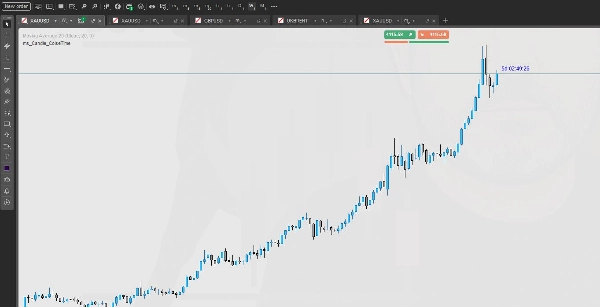
ms_Candle_ColseTime
インジケーター
496 ダウンロード数
バージョン 1.0、Oct 2025
Windows、Mac
説明
価格: 無料
キャンドルのタイミングを二度と見失わないでください!
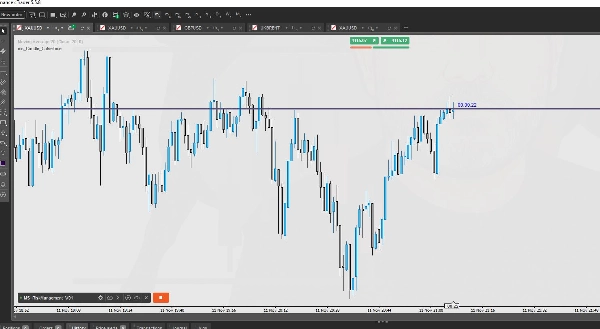
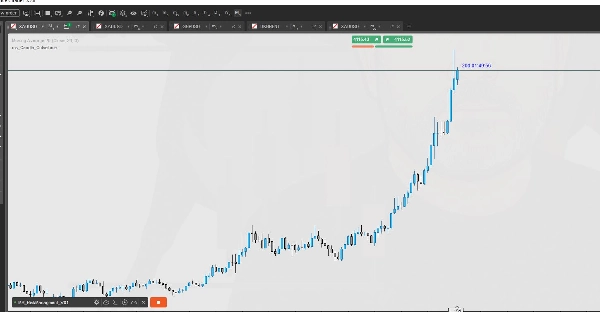
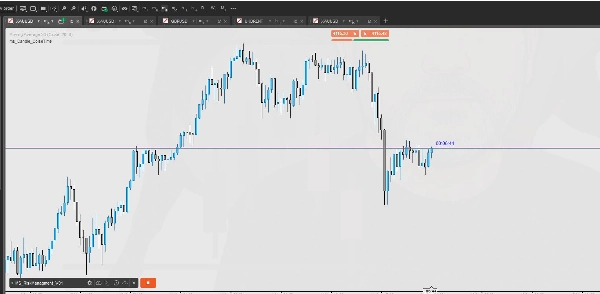
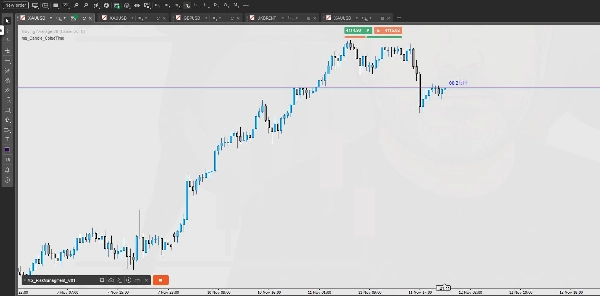
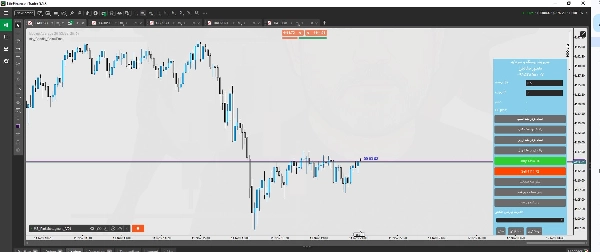
この 残りキャンドル時間 インジケーターは、現在のキャンドルが閉じるまでの 正確な残り時間 を表示します — すべての時間軸 と 任意の銘柄 に対応し、市場の動きに合わせて動的に更新されます。
💡 主な特徴
- マルチタイムフレーム対応 — すべての 時間軸(1分から1ヶ月チャートまで)でシームレスに動作します。
- リアルタイムカウントダウン — 毎ティックごとに連続更新され、市場の時計と完全に同期しています。
- フローティング表示 — タイマーはライブの市場価格に合わせて動的に移動し、必要な場所で常に見えるようにします。
- コンパクトで明確なUI — クリーンなタイポグラフィと自動調整された配置で最大の読みやすさを実現。
- カスタマイズ可能な配置 — カウントダウンの表示位置を簡単に選択可能(例:価格近く、右上、左下など)。
- 軽量かつ高速 — CPU使用率が最小限で、複数のチャートやインジケーターを使用するトレーダーに最適です。
⚙️ 仕組み
- インジケーターは自動的にチャートの現在の時間軸とサーバー時間を検出します。
- 現在のキャンドルが閉じるまでの正確な残り時間を計算します。
- 市場がティックごとに動いている場合でもリアルタイムで更新されます。
🧭 トレーダーに愛される理由
- キャンドルのクローズを待つ スキャルパー と デイトレーダー に最適です。
- ブレイクアウト、確認、バークローズシグナル のタイミングを常に把握できます。
- 遅延なし、リフレッシュ遅延なし — 純粋なリアルタイム精度。
⚠️ 対応環境
- プラットフォーム: cTrader デスクトップ
- 対応:すべてのシンボルと時間軸
- 推奨使用法:あらゆる取引スタイル — スキャルピング、デイトレード、スイングトレード
残りキャンドル時間インジケーターの使い方
このインジケーターは特別な設定を必要としません。
チャートに取り付けるだけで、選択した時間軸に基づいて現在のキャンドルの残り時間を自動的に表示します。
すべての 時間軸 で動作します。
概要
AIによる概要
The ms_Candle_ColseTime indicator for cTrader Desktop provides a real-time countdown of the remaining time until the current candle closes on any chart. It automatically detects the chart’s timeframe and server time, then continuously updates the exact time left until candle closure with each market tick. This indicator supports all timeframes, from 1-minute to monthly charts, and works on all trading instruments available on the platform.
Key features include a floating display that moves dynamically with the live market price, customizable positioning options (e.g., near price, top-right, bottom-left), and a compact, clear user interface designed for readability. It is lightweight and optimized for minimal CPU usage, making it suitable for traders running multiple charts or indicators simultaneously.
This tool is particularly useful for scalpers and intraday traders who rely on precise candle close timing for entries, breakouts, confirmations, and bar close signals. It requires no special configuration—simply attach it to a chart to start viewing the countdown. The indicator supports all trading styles including scalping, day trading, and swing trading.
インジケーターのプロフィール
カスタマーレビュー
0.0
レビュー: 0
カスタマーレビュー
この商品にはまだレビューがありません。お使いになったことがある方は、ぜひレビューをお願いします。
ディスカッション
よくあるご質問
Forex
cTrader Storeで入手可能な取引ボット、インジケーター、プラグインなどの商品は、第三者の開発者が提供するものであり、情報と技術の取得のみを目的としてご利用いただけます。cTrader Storeはブローカーではなく、投資助言や個人的な推奨を行うことも、将来のパフォーマンスを保証することもありません。
この作成者の他の商品


価格
20.18M
取引数量
105.55K
獲得pips
978
無料インストール