
说明
吊灯翻转止损(cTrader)
它是什么
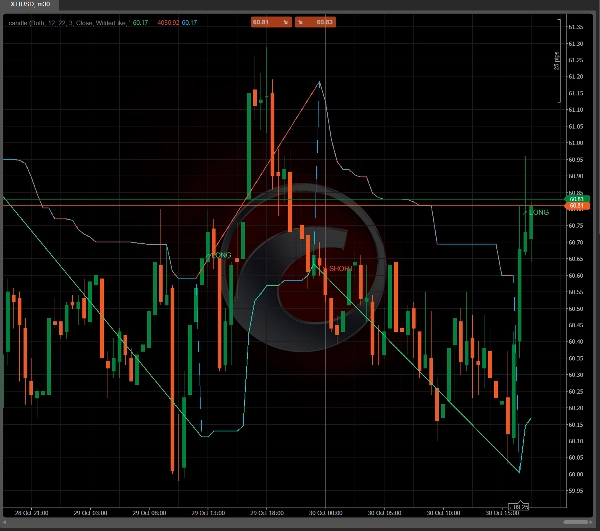
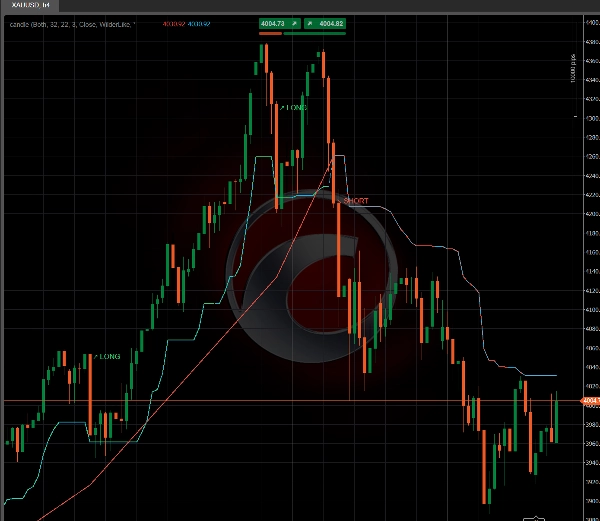
cTrader 的 吊灯退出 的一个简洁实现。它构建了一个 动态追踪止损,锚定在最近 N 根K线的最高/最低点,并偏移 ATR × 乘数。在多头状态下,止损只能 上升;在空头状态下,止损只能 下降。当价格突破当前止损时,指标会 反转方向 并发出一个 信号。
信号触发时
- 多头信号(翻转为多头): 价格 突破上方 短期止损线。
-
- 当 使用收盘价判断突破 = 开启(推荐):K线 收盘价高于 短期止损线。
- 当 关闭:K线内高点突破短期止损线即可。
- 空头信号(翻转为空头): 价格 跌破 多头止损线。
-
- 开启:K线 收盘价低于 多头止损线。
- 关闭:K线内低点跌破多头止损线即可。
警报名称清晰明了: “关闭空头(翻转多头)” 和 “关闭多头(翻转空头)”。
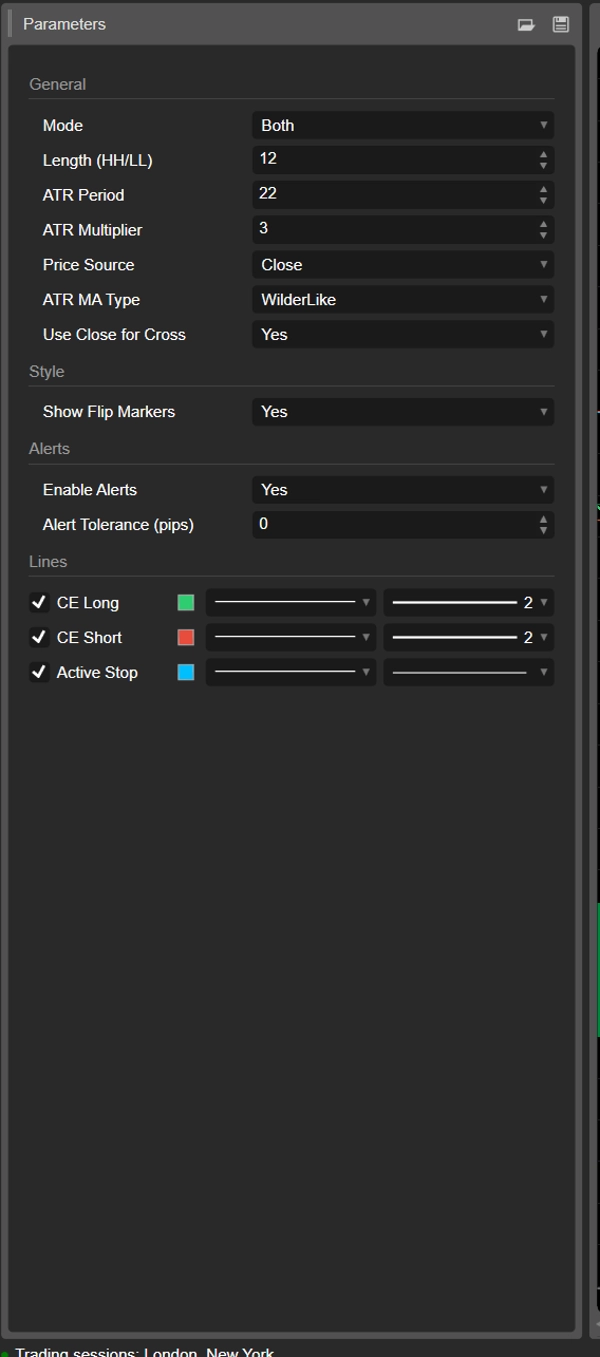
关键参数
- 长度(最高/最低): 极值回溯窗口(默认22)。
- ATR周期及乘数: 波动率窗口和距离(默认22和3.0)。
- 价格来源: 收盘价,HL2,HLC3,OHL4(用于交叉逻辑)。
- 使用收盘价判断突破: 若开启,信号仅在 K线收盘时 触发;若关闭,可在 K线内 触发。
- 模式: 双向 / 仅多头 / 仅空头。
- 警报(可选): 启用警报并使用 警报容差(点数) 来减少止损附近的噪音。
图形显示
- CE多头(绿色)/ CE空头(红色):特定状态的追踪线。
- 活动止损: 当前活动止损的单条便捷线。
- 标记: 状态变化时的“关闭空头(翻转多头)”/“关闭多头(翻转空头)”。
典型用途
- 仓位追踪: 将您的订单止损映射到 活动止损。
- 趋势过滤: 当CE多头激活时仅多头;当CE空头激活时仅空头。
- 翻转入场: 在状态翻转时入场(考虑时间框架/容差以减少震荡)。
摘要
AI 摘要
Chandelier Flip Stop is an indicator for cTrader that implements a dynamic trailing stop based on the Chandelier Exit concept. It calculates stops anchored to the highest or lowest price of the last N bars, offset by the Average True Range (ATR) multiplied by a configurable factor. In a long regime, the stop only moves upward; in a short regime, it only moves downward. When the price crosses the active stop, the indicator flips direction and generates a corresponding signal: a LONG signal when price crosses above the short stop, and a SHORT signal when price crosses below the long stop. Users can configure whether signals trigger on candle close or intrabar price movements.
Key parameters include the lookback length for highs/lows, ATR period and multiplier, price source for cross detection, and operational mode (both, long-only, or short-only). The indicator plots regime-specific trailing lines (green for long, red for short), a single active stop line, and markers indicating regime flips. Alerts can be enabled with adjustable tolerance to reduce noise.
Typical uses include trailing position stops mapped to the active stop, trend filtering by regime, and entry signals on regime flips. The indicator supports clear signal naming for ease of interpretation.
指标配置
客户评价
0.0
评价:0
客户评价
该产品尚无评价。已经试过了?抢先告诉其他人!
讨论
常见问答
Signal
ATR
cTrader Store 提供的所有产品,包括交易机器人、指标和插件,均由第三方开发者提供,仅供信息参考和技术访问之用。cTrader Store 并非经纪商,不提供投资建议、个人推荐或任何未来业绩保证。


价格
42.11M
交易量
6.13M
盈利点数
215
销售
8.28K
免费安装