Smart Money Concept Indicator
Indikator
Versi 1.0, Nov 2025
Windows, Mac
Deskripsi
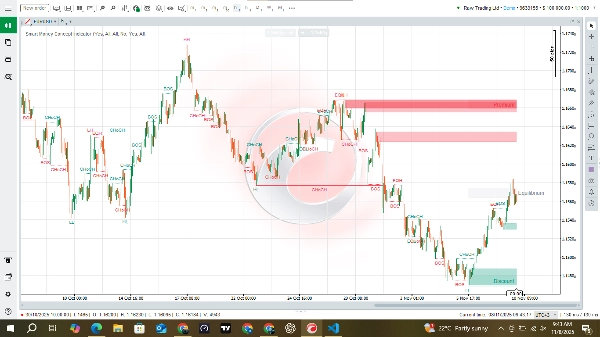
Konsep Uang Pintar — gambaran tingkat tinggi
Konsep Uang Pintar memvisualisasikan di mana aktivitas profesional / institusional kemungkinan memengaruhi harga. Ini secara otomatis mengidentifikasi struktur pasar (struktur ayunan dan jangka pendek), menyoroti pelanggaran struktur (BOS) dan perubahan karakter (CHoCH), menemukan titik tertinggi/terendah yang sama, menangkap rentang blok pesanan kandidat (area di mana pemain besar mungkin telah menempatkan pesanan), dan melukis zona kontekstual (premium, keseimbangan, diskon). Ini menyesuaikan dengan volatilitas pasar sehingga ambang batasnya menyesuaikan dengan aktivitas instrumen saat ini.
Apa yang didapat trader sekilas
- Label jelas yang menunjukkan kapan struktur berbalik atau dilanggar (membantu Anda menentukan bias).
- Area blok pesanan yang disorot — kantong pasokan/permintaan potensial di mana harga sering diuji ulang.
- Penanda titik tertinggi/terendah yang sama — kemungkinan node likuiditas untuk perburuan stop atau pengujian ulang.
- Zona konteks — premium (mahal), keseimbangan (nilai wajar), diskon (murah) — berguna untuk bias dan target.
- Titik tertinggi & terendah kuat yang mengikuti yang menunjukkan ekstrem signifikan terbaru.
Mengapa ini berguna bagi trader SMC
- Mempercepat identifikasi level: menggambar dan menyimpan level sehingga Anda tidak perlu mencari pivot dan OB secara manual.
- Konsistensi: menerapkan aturan yang sama untuk mendeteksi pembalikan struktur dan kandidat OB di berbagai instrumen dan kerangka waktu.
- Entri kontekstual: menunjukkan di mana minat institusional mungkin berada — trader dapat merencanakan entri pada pengujian ulang area tersebut daripada menebak.
- Pembingkaian risiko: zona dan tepi OB memberikan tempat logis untuk stop dan target (misalnya, stop di luar titik rendah/tinggi OB).
- Alur kerja multi-skala: gunakan struktur skala besar untuk bias dan struktur internal yang lebih kecil untuk entri yang tepat.
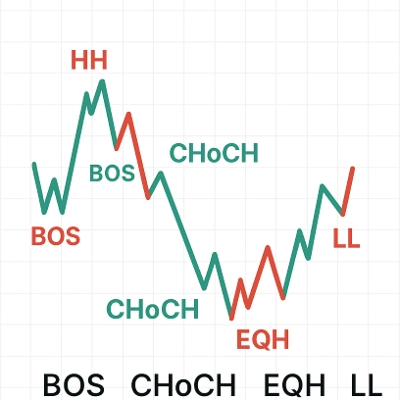
Cara menginterpretasikan elemen utama
- BOS (Break of Structure) — sinyal kelanjutan ke arah pelanggaran; berguna untuk mengonfirmasi tren.
- CHoCH (Change of Character) — indikasi bahwa perilaku pasar mungkin berbalik; perlakukan sebagai potensi pembalikan atau perubahan bias.
- Order Blocks (OBs) — rentang harga di mana pesanan besar kemungkinan terkumpul; harapkan pengujian ulang dan penolakan di sana.
- Tinggi/rendah yang sama — level berulang di mana likuiditas terkumpul; sering menjadi target sebelum pergerakan besar.
- Premium/Keseimbangan/Diskon — peta nilai sederhana: premium menguntungkan penjual, diskon menguntungkan pembeli, keseimbangan netral/rata-rata.
Ringkasan
Profil indikator
Ulasan pelanggan
0.0
Ulasan: 0
Ulasan pelanggan
Belum ada ulasan untuk produk ini. Sudah mencobanya? Jadilah pemberi ulasan pertama!
Diskusi
Pertanyaan umum
BTCUSD
Forex
Indices
EURUSD
Commodities
GBPUSD
Prop
SMC
Crypto
Stocks
XAUUSD
NAS100
USDJPY
Produk-produk yang tersedia melalui cTrader Store, termasuk bot trading, indikator, dan plugin, disediakan oleh pengembang pihak ketiga serta hanya ditujukan untuk akses teknis dan informasi. cTrader Store bukan broker dan tidak menyediakan saran investasi, rekomendasi pribadi, atau jaminan apa pun tentang kinerja di masa mendatang.
Produk lain dari penulis ini


Harga
Sejak 14/06/2025
1
Penjualan