Descrição
📈 Indicador de Viés de Volatilidade Skew – Versão Profissional (para cTrader)
Desbloqueie uma compreensão mais profunda da pressão do mercado, desequilíbrio de volatilidade e convicção direcional com o Indicador de Viés de Volatilidade Skew, a versão aprimorada de uma abordagem clássica baseada em volatilidade originalmente inspirada pelo Pine Script e agora totalmente otimizada para cTrader.
Esta ferramenta ajuda os traders a visualizar qual lado do mercado está mais forte — compradores ou vendedores — medindo a assimetria da volatilidade e convertendo-a em um sinal claro e fácil de ler.
Quer você negocie índices, forex, commodities ou criptomoedas, este indicador serve como um poderoso filtro de tendência, detector de regime e ferramenta de confirmação de viés.
1. O que o Indicador Skew Mede
O indicador avalia o equilíbrio da volatilidade entre velas de alta e de baixa.
Ele calcula um True Range normalizado e o alimenta em duas médias adaptativas:
- Desvio Máximo → volatilidade produzida durante velas de alta
- Desvio Mínimo → volatilidade produzida durante velas de baixa
Então ele calcula:
👉 Skew = DesvioMáximo / DesvioMínimo
Isso converte a volatilidade bruta em uma leitura direcional clara:
- Skew > 1 → movimentos de alta são mais fortes em média
- Skew < 1 → movimentos de baixa são mais fortes
- Skew ≈ 1 → volatilidade é simétrica e o mercado está equilibrado
Em resumo:
Skew revela qual lado tem “domínio da volatilidade”.
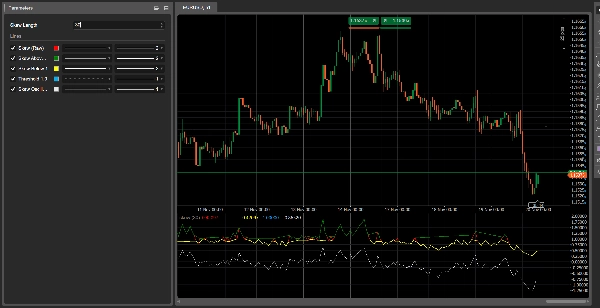
2. Entendendo as Linhas
1. Skew (Bruto) – Linha vermelha
A razão pura da volatilidade. Este é o sinal principal.
2. Skew Acima de 1 – Linha verde
Mostra domínio da volatilidade de alta.
3. Skew Abaixo de 1 – Linha amarela
Mostra domínio da volatilidade de baixa.
4. Linha de Limite 1.0 – Linha azul pontilhada
Representa o equilíbrio.
5. Oscilador Skew (log) – Linha branca
Representação mais estável e suave:
- acima de 0 = volatilidade de alta
- abaixo de 0 = volatilidade de baixa
3. Como Interpretar
A) Regimes de Mercado
🔹 Regime de Alta
- Skew > 1
- Linha verde ativa
- Oscilador acima de zero
→ O mercado favorece posições longas.
🔹 Regime de Baixa
- Skew < 1
- Linha amarela ativa
- Oscilador abaixo de zero
→ O mercado favorece posições curtas.
🔹 Neutro
- Skew ≈ 1
→ Mercado equilibrado, adequado para negociação em faixa.
4. Sinais de Mudança de Regime
Skew cruzando acima de 1
→ Compradores ganham domínio da volatilidade
→ Transição para alta
Skew cruzando abaixo de 1
→ Vendedores ganham domínio da volatilidade
→ Transição para baixa
Essas mudanças frequentemente ocorrem antes da ação do preço confirmar uma tendência, tornando o Skew um indicador precoce poderoso.
5. Casos Práticos de Uso
1️⃣ Filtro de Tendência para cBots
- negociar comprado apenas quando SkewOsc > 0
- negociar vendido apenas quando SkewOsc < 0
2️⃣ Confirmação da Qualidade da Tendência
- Tendência de alta + Skew > 1 = tendência forte
- Tendência de alta + Skew caindo em direção a 1 = tendência enfraquecendo
3️⃣ Sentimento de Mercado / Filtro de Risco
Particularmente eficaz em índices e pares principais de FX.
6. Resumo
- O que mostra: domínio da volatilidade
- Por que importa: mudanças na volatilidade precedem mudanças no preço
- Como usar: como filtro, ferramenta de confirmação ou medidor de sentimento
- Melhor parte: extremamente leve, rápido e adaptável
Resumo
Avaliações de clientes
5 | 67 % | |
4 | 33 % | |
3 | 0 % | |
2 | 0 % | |
1 | 0 % |


