
Order Flow Ticks v2.0
Indicador
12.05K transferências
Versão 1.1, Jan 2026
Windows, Mac
4.4
Avaliações: 23
Descrição
Última Descrição -> 11/11/2025
Cada aspecto do Order Flow Ticks (versão agregada) foi cuidadosamente projetado com desempenho em mente, para que possa rodar mesmo em máquinas de menor desempenho.
Ainda assim, aqui estão algumas "Dicas e Truques" para melhor uso:
- Os dados de ticks são armazenados na RAM, embora o cTrader já tenha uma boa gestão de memória:
-
- Carregue apenas o que é realmente necessário para a negociação ao vivo.
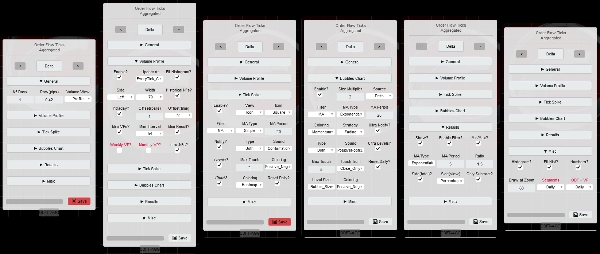
- Painel de Parâmetros já mostra quais parâmetros são suportados por cada modo.
- Intervalo de Segmentos pode alterar a análise dos filtros, use o intervalo Diário para o momentum Intraday.
- Em Timeframes Maiores (Gráficos Baseados em Preço incluídos)
-
- Configure ODF + VP para Semanal
- Nº dias / Reset Diário? parâmetros agora são Semana/Semanal.
- Todos os filtros serão resetados a cada Semana em vez de a cada Dia.
- "Timeframe Inferior" com "Tamanho Pequeno de Linha":
-
- Médias Móveis Personalizadas são feitas para acelerar o recálculo ao alternar configurações no Painel de Parâmetros.
- Se quiser continuar com as Médias Móveis do cTrader, configure [ODF] Usar Médias Móveis Personalizadas? para Falso
-
- Tenha paciência se algum Filtro [Resultados / Pico / Bolhas] estiver ativado.
- Se Alto Desempenho for necessário:
-
- Desative o Perfil de Volume e/ou use Mini-VPs em vez disso. (padrão)
- Use "Concorrente" em "[VP] Estratégia de Atualização" em "Configurações Específicas", embora haja um custo de uso de RAM. (padrão)
- Use "Redraw_Fastest" nas configurações de "Desenho de Desempenho" (padrão)
- Use Médias Móveis Personalizadas (padrão)
- Qualquer desenho preenchido e/ou de Texto é bastante pesado quando há muitos deles.
- Ao fazer back-testing, alguns desenhos em Gráficos Baseados em Preço ficam quebrados, mas funcionam bem em tempo real.
- Configurações Salvas são armazenadas em "Documents/cAlgo/LocalStorage/ODFT-AGG ..."
Novos recursos de análise do Order Flow Ticks:
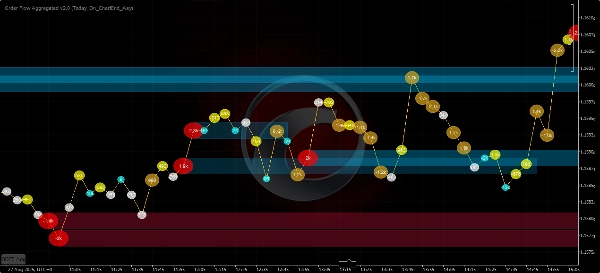
- Filtro de Pico de Tick
-
- Média Móvel ou Desvio Padrão.
- como Ícone ou Bolhas.
- Níveis de Pico.
- Gráfico de Pico (Bolhas):
-
- Coloração Heatmap.
- Coloração Positiva/Negativa.
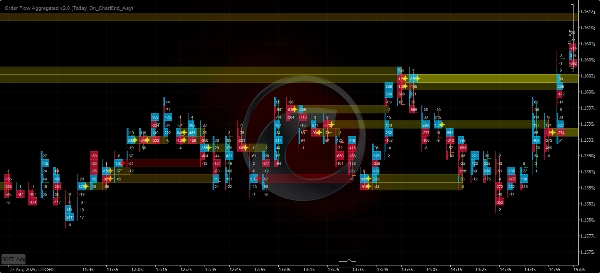
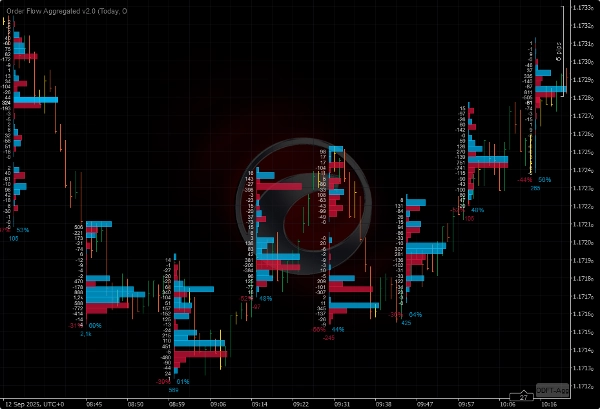
- Gráfico de Bolhas
-
- Médias Móveis, Desvio Padrão, ou ambos.
- [Delta de Volume / Delta Cumulativo / Subtrair Delta] como fonte.
- Níveis Ultra Bolhas.
- Coloração Heatmap.
- Coloração de Momentum:
-
- Desvanecimento
- Positivo/Negativo
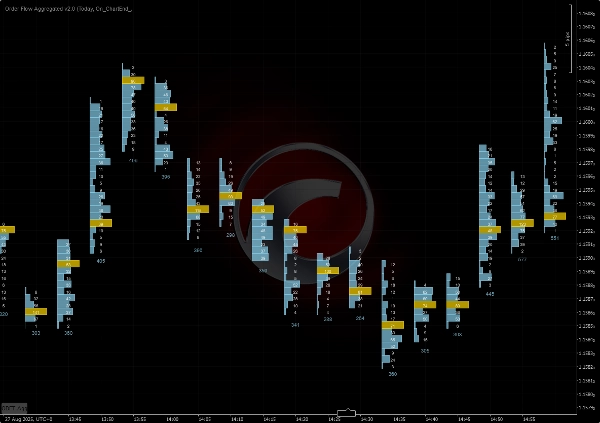
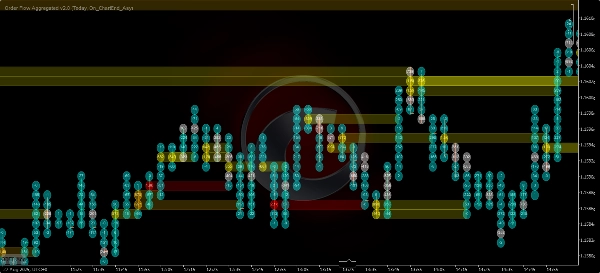
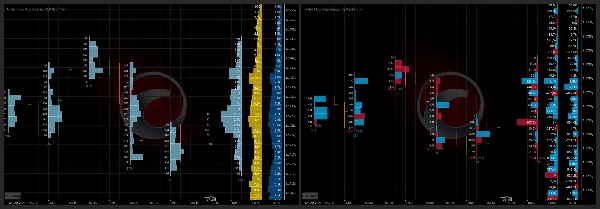
- Perfil de Volume
-
- Mini-VPs - De 5 minutos a 1 dia.
- Perfis Diários, Semanais, Mensais!
- Perfis de Intervalo Fixo.
=============================
Prefira sempre a versão da Loja do cTrader, ela é atualizada primeiro.
Todos os indicadores que desenvolvi são de código aberto. Se você não tem acesso ao código, confira o repositório do Github
Resumo
Resumo de IA
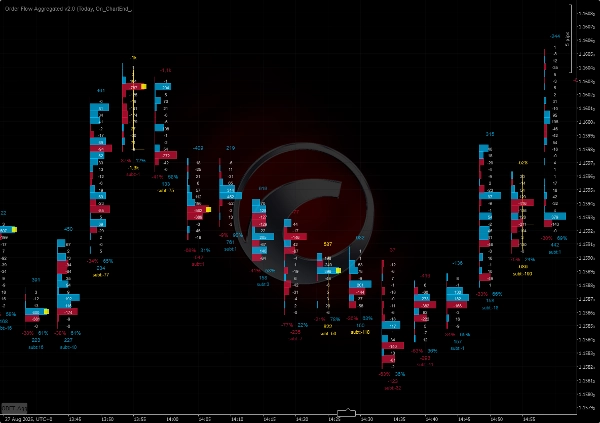
Order Flow Ticks v2.0 is an open-source indicator for the cTrader platform that adapts traditional Order Flow (Footprint) concepts to tick volume data. It supports multiple chart types including ticks, Renko, and range charts. The indicator offers several visualization modes: Normal Mode (volume profile per bar), Buy vs Sell Divided Mode (bid/ask footprint), Buy vs Sell Profile Mode, Delta Divided Mode (delta footprint), and Delta Profile Mode.
Version 2.0 introduces a parameters panel for quick switching between settings such as volume modes and row height, and it uses the Colors API exclusively. It is compatible with Mac OS and requires .NET 6.0 or higher.
Key features include:
- Tick Spike Filter with moving average or standard deviation, displayed as icons or bubbles with heatmap and positive/negative coloring.
- Bubbles Chart showing volume delta, cumulative delta change, or subtract delta with momentum coloring and ultra bubble levels.
- Volume Profile options including mini-profiles from 5 minutes to 1 day, daily, weekly, monthly, and fixed range profiles.
The indicator is optimized for performance to run efficiently on lower-end machines. It stores tick data in RAM and offers settings to balance performance and detail, including custom moving averages and concurrent update strategies. Saved settings are stored locally.
Perfil do indicador
Avaliações de clientes
4.4
Avaliações: 23
5 | 74 % | |
4 | 13 % | |
3 | 4 % | |
2 | 0 % | |
1 | 9 % |
Avaliações de clientes
May 13, 2026
Just a note to say thank you to the creator for making this free of charge. Appreciate it.
March 23, 2026
It's great, Thank you! Can you pls make an update, it doesnt work fully on Indices on CFD
March 9, 2026
"Thank you very much for your work on Order Flow Tick 2.0. It is truly excellent and unique."
October 22, 2025
this is great, i just can't see all the options because the panel is cut short. i don't have access to the bubbles and other features that are apparently there in the code
September 27, 2025
August 3, 2025
Amazing indicator! Once you learn how to use it it really helps out so much, love it!
July 9, 2025
Pros: Real-time tick flow visualization with buy/sell separation. Helps assess market activity and hidden liquidity. Easy to set up, works stable on major assets. Cons: No alerts on tick spikes. No history or tooltips. Requires experience to interpret data correctly.
July 3, 2025
June 20, 2025
Great indicator. It takes a bit of work to learn how to use it properly. Not to be used in isolation, you need to plan potential reversal zones.
April 15, 2025
This looks promising! I tested it out manually, but I would love to automate it! How could we get the source code? :) Really, Pls.
Conversa
Perguntas frequentes
VWAP
Os produtos disponíveis através da cTrader Store, incluindo bots de negociação, indicadores e plugins, são fornecidos por programadores terceiros e são disponibilizados apenas para fins informativos e de acesso técnico. A cTrader Store não é um corretor e não fornece aconselhamento em matéria de investimento, recomendações pessoais ou qualquer garantia de desempenho no futuro.


Preço
Desde 12/12/2024
1
Vendas
33.12K
Instalações gratuitas