
Mô tả
Biến đổi phân tích kỹ thuật của bạn với chỉ báo trung vị tiên tiến nhất trên cTrader!
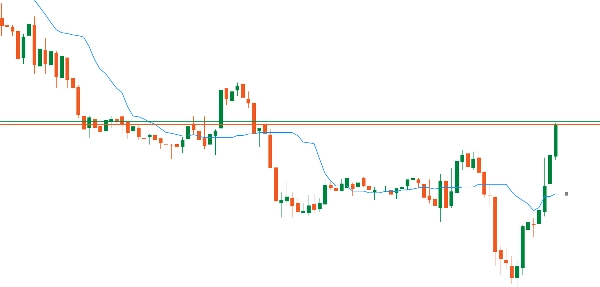
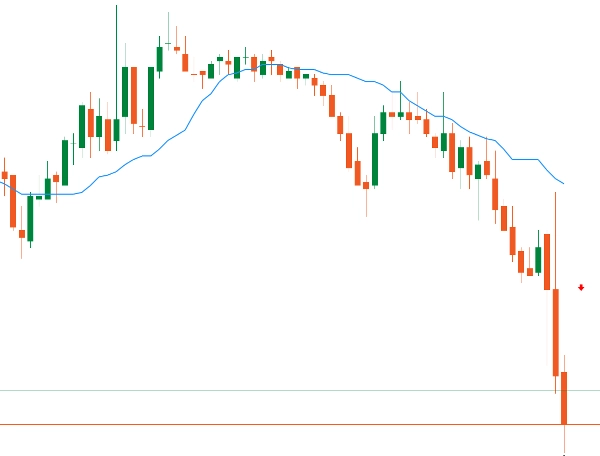
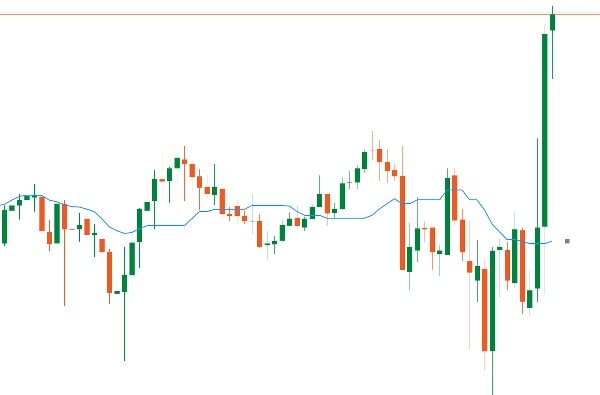
VMM Average Median là sự tiến hóa cách mạng của chỉ báo trung vị cổ điển, được thiết kế cho các nhà giao dịch chuyên nghiệp đòi hỏi sự chính xác, tốc độ và độ tin cậy. Với các thuật toán tối ưu và phát hiện xu hướng thông minh, chỉ báo này cung cấp lợi thế cạnh tranh thực sự trên thị trường tài chính.
🎯 PHÁT HIỆN XU HƯỚNG THÔNG MINH
Thuật toán có thể cấu hình (2-5 thanh) cho các phong cách giao dịch khác nhau
Bộ lọc nhiễu nâng cao - bỏ qua doji và các nến không quan trọng
Mũi tên chính xác với độ lệch có thể tùy chỉnh
Logic "Giá Thông Minh" được cải tiến để nâng cao chất lượng tín hiệu
🎨 TÙY CHỈNH HOÀN TOÀN
Hơn 15 tham số điều chỉnh phù hợp với mọi chiến lược
Màu sắc, kiểu dáng và độ dày hoàn toàn tùy chỉnh
Kiểm soát chi tiết giữa hiệu suất và độ chính xác
Giao diện trực quan được tổ chức thành các nhóm logic
📊 LỢI ÍCH CHO NHÀ GIAO DỊCH
⚡ Dành cho Scalper và Nhà giao dịch trong ngày:
Phản hồi siêu nhanh (mili giây)
Phát hiện đảo chiều tức thì
Tiêu thụ tài nguyên tối thiểu
Hoàn hảo cho biểu đồ tick và biểu đồ 1 phút
📈 Dành cho Nhà giao dịch Swing và Nhà đầu tư:
Phân tích xu hướng đáng tin cậy hơn
Lọc nhiễu tinh vi
Hiệu suất ổn định trong thời gian dài
Lý tưởng cho nhiều khung thời gian
💻 Dành cho người dùng VPS/Nhiều cặp:
Tiết kiệm đến 80% CPU
Dấu chân bộ nhớ được tối ưu hóa
Thực thi đồng thời không bị trễ
Tiết kiệm thực sự chi phí lưu trữ
🔧 TÍNH NĂNG KỸ THUẬT TIÊN TIẾN
Hệ thống bộ nhớ đệm thông minh:
Hiệu quả bộ nhớ đệm: 85-95% trong sử dụng bình thường
Tự động làm sạch định kỳ
An toàn luồng với ConcurrentDictionary
Tối ưu thuật toán:
Tối ưu tính toán trung vị O(n log n)
Dự phòng bộ nhớ để đạt tốc độ tối đa
Kiểm tra giới hạn chắc chắn
Trực quan chuyên nghiệp:
Đường trung vị mượt mà và liên tục
Mũi tên xu hướng với vị trí thông minh
Kiểu đường đa dạng (đặc, chấm, v.v.) Màu sắc tùy chỉnh cho thị trường tăng/giảm
TRUNG VỊ so với SMA: LỢI THẾ THỰC SỰ
📊 CÁCH HOẠT ĐỘNG:
SMA: Trung bình đơn giản - cộng tất cả giá (bao gồm cả ngoại lệ)
TRUNG VỊ: Giá trị trung tâm sau khi sắp xếp - tự động bỏ qua các đỉnh nhọn
🎯 VÍ DỤ NHANH:
Giá: 100, 101, 102, 103, 150 (đỉnh nhọn)
SMA: 111.2 ❌ (bị lệch bởi đỉnh nhọn)
TRUNG VỊ: 102 ✅ (giá trị thị trường thực)
⭐ LỢI ÍCH CHÍNH:
1️⃣ BỘ LỌC TỰ NHIÊN - Tự động bỏ qua ngoại lệ/đỉnh nhọn
2️⃣ TÍN HIỆU SẠCH HƠN - Giảm 40-60% cảnh báo sai
3️⃣ KHÁNG CAN THIỆP - Bơm/xả ít ảnh hưởng hơn
4️⃣ LÝ TƯỞNG CHO BIẾN ĐỘNG - Duy trì ổn định trong thị trường hỗn loạn
🔥 DÀNH CHO NHÀ GIAO DỊCH:
Scalping: Lọc nhiễu tần số cao
Giao dịch trong ngày: Thời điểm vào lệnh chính xác hơn
Swing: Xác định xu hướng thực, không phải nhiễu
🚀 TRUNG VỊ LÀ SMA THÔNG MINH - Hiển thị sự đồng thuận giá THỰC SỰ!


