Descrição
Descrição curta
Mapa de Regime de Tendência & Volume é um filtro de regime para cTrader que mede a direção e persistência tanto do preço quanto do volume. Ele fornece uma pontuação de tendência normalizada e uma pontuação de tendência de volume no intervalo –10 a +10, colore suas velas com um gradiente suave do vermelho baixista ao verde altista, e mostra se o ambiente atual está em risco, fora de risco ou apenas barulhento.
🧠 O que ele faz
Este indicador replica a lógica do “Filtro de Regime” de BigBeluga do TradingView, adaptado para cTrader e incorporado em um claro mapa de regime de tendência & volume.
Preço & volume suavizados
- Calcula HLC3 (média de Alta, Baixa, Fechamento) e aplica uma Média Móvel Hull (HMA) para suavizar o preço.
- Aplica outra Média Móvel Hull ao volume de ticks.
Pontuação de tendência (preço)
- Para as últimas N barras (
Length), compara a HMA atual do preço com cada valor passado da HMA:
- Se HMA atual > HMA passada → tendência +1
- Se HMA atual ≤ HMA passada → tendência –1
- A pontuação acumulada é escalada para –10 … +10 → este é o valor da Tendência.
Pontuação de tendência de volume
- Usa a mesma lógica, mas aplicada à HMA do volume.
- O resultado é outra pontuação normalizada em –10 … +10 → o valor do Volume.
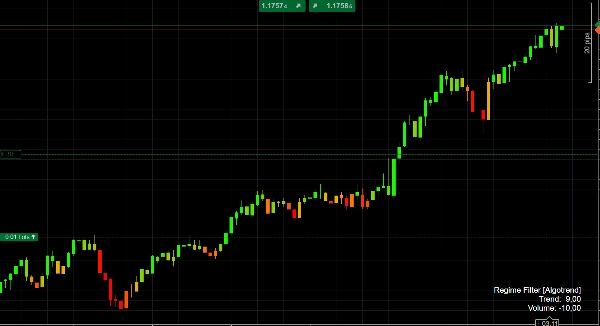
Lógica de cor
- Quando a pontuação da Tendência é negativa, as velas são coloridas com um gradiente vermelho → laranja dependendo da força do regime de baixa.
- Quando a pontuação da Tendência é positiva, as velas são coloridas laranja → lima, com verde mais forte para regimes de alta mais fortes.
Isso lhe dá uma indicação visual instantânea se a ação do preço está baixista, neutra ou altista, e quão persistente esse regime está atualmente.
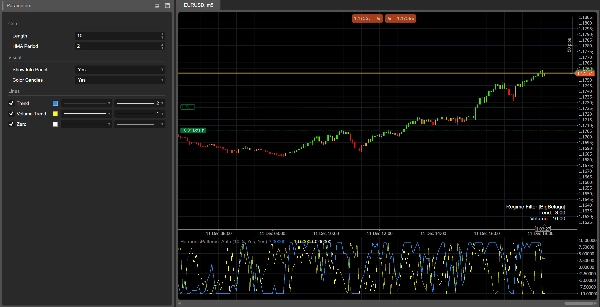
Painel de regime
Na subjanela, o indicador plota:
- Linha de Tendência (azul)
- Linha de tendência de Volume (cinza)
- Linha Zero (linha base)
Na última barra, imprime um pequeno painel de informações com os valores atuais de Tendência e Volume.
🎯 Como você pode usar
Confirmação de tendência
- Negocie apenas na direção de um regime forte, por exemplo:
- Tendência > +4 → viés apenas de compra
- Tendência < –4 → viés apenas de venda
Filtro de regime
- Desative ou reduza sua estratégia quando o regime estiver fraco (Tendência próxima de 0) ou quando a tendência de Volume estiver fortemente negativa, o que frequentemente sinaliza movimentos irregulares ou em declínio.
Contexto para sinais
Combine seus sinais de entrada existentes (ação do preço, padrões harmônicos, osciladores, etc.) com Mapa de Regime de Tendência & Volume como um filtro macro:
- Apenas faça breakouts quando a Tendência for positiva e a tendência de Volume também for positiva.
- Evite configurações de reversão à média quando a Tendência estiver extremamente forte (> +8 ou < –8), pois o mercado está em um regime direcional poderoso.
⚙️ Parâmetros de entrada
Núcleo
Length
Número de barras usadas para construir as pontuações de tendência e volume.
- Valores maiores → regime mais suave, mais “macro”; mais lento para mudar, mas mais estável.
- Valores menores → resposta mais rápida, mas mais ruído e mudanças mais frequentes.
Período HMA
Período da Média Móvel Hull usada para suavizar tanto o preço quanto o volume.
- Ajuste para combinar com seu timeframe e estilo de negociação: mais curto para timeframes baixos, mais longo para timeframes altos.
Visual
Mostrar Painel de Informações
Mostra/oculta o pequeno painel de texto na última barra com as pontuações atuais de Tendência e Volume.Colorir Velas
Habilita a coloração das velas com base no valor da Tendência (gradiente vermelho / laranja / verde). Desative se preferir manter as cores padrão do seu gráfico.
✅ Folha de dicas para interpretação
- Tendência ≥ +7 → regime altista forte, velas verde brilhante.
- Tendência entre +3 e +7 → viés altista; recuos são potenciais zonas de compra.
- Tendência entre –3 e +3 → lateral / irregular; sinais são menos confiáveis.
- Tendência ≤ –7 → regime baixista forte, velas vermelho intenso.
- Tendência de volume > 0 → atividade crescente / sustentada, movimentos têm mais probabilidade de serem “reais” e persistentes.
- Tendência de volume < 0 → participação em declínio, maior risco de movimentos falsos, irregularidade ou reversões.
Resumo
Avaliações de clientes
5 | 0 % | |
4 | 100 % | |
3 | 0 % | |
2 | 0 % | |
1 | 0 % |


