Descrição
A Vantagem Ponderada pelo Volume: Um Roteiro Completo para o Momentum no cTrader
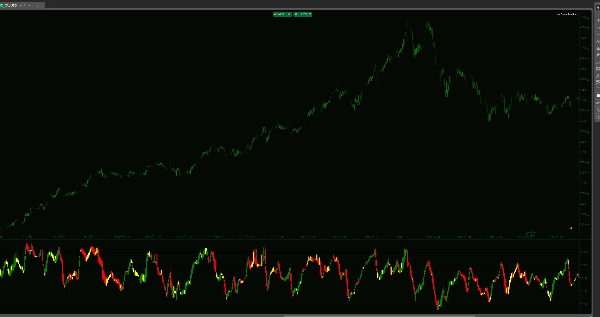
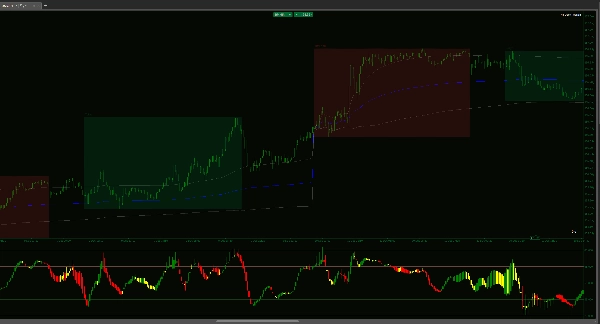
Indicadores padrão mostram onde o preço esteve. O indicador Volume-Weighted RSI Candles mostra a convicção por trás do movimento. Ao mesclar a ação do preço, o volume de ticks e cinco níveis institucionais críticos, esta ferramenta transforma o RSI de um simples oscilador em um sistema abrangente de mapeamento de tendências.
Em vez de uma única linha, você obtém velas OHLC completas na janela do seu indicador. Isso permite que você veja a "estrutura" do momentum—revelando se um movimento é sustentado por um volume institucional pesado ou é simplesmente um "falso rompimento" de baixa liquidez.
A Estratégia de Execução das 5 Zonas
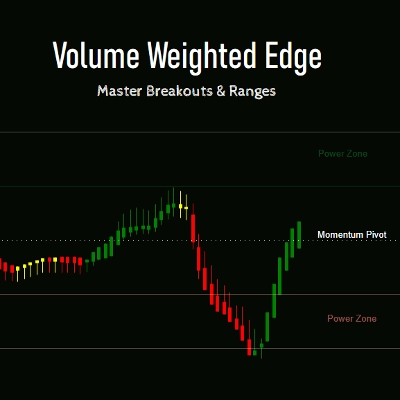
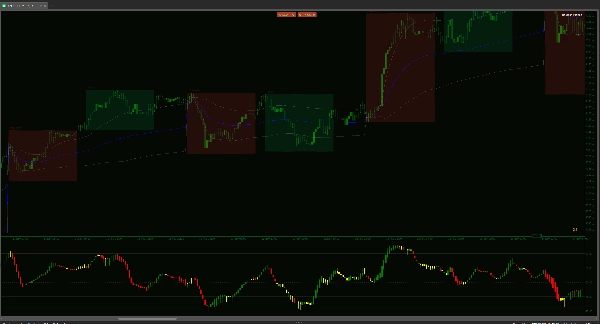
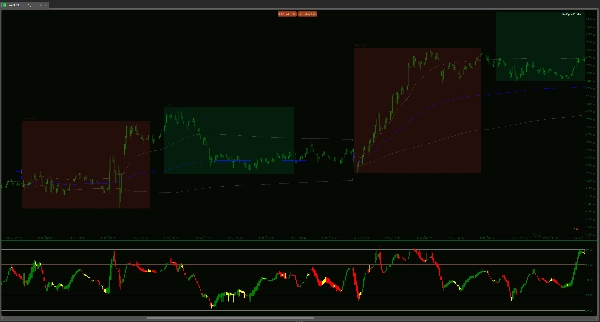
- As Extensões de Poder (65–80 & 20–35): Estas são as zonas de alta convicção. Quando as velas ponderadas pelo volume se mantêm aqui, você não está procurando reversões—você está seguindo a tendência. É aqui que o dinheiro grande opera e onde acontecem os movimentos mais explosivos.
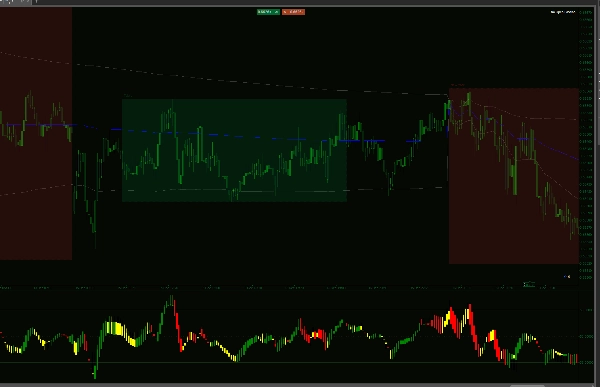
- Os Corredores de Scalping (50–65 & 35–50): Perfeitos para a sessão asiática ou mercados em faixa. Quando a tendência de timeframe superior é neutra, essas zonas fornecem alvos de "reversão à média" de alta probabilidade. Se o mercado estiver em faixa, esses corredores permitem que você faça scalping nas rotações com precisão cirúrgica.
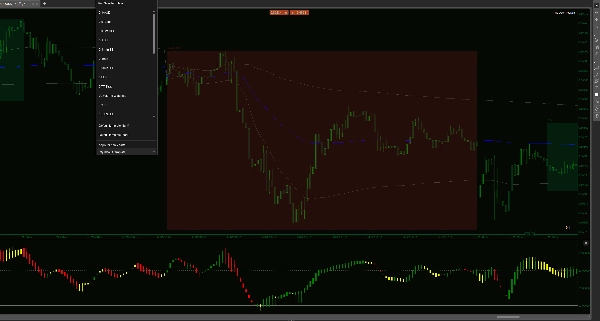
- O Pivô do Momentum (50): A linha definitiva na areia. Um corpo de vela ponderado pelo volume fechando acima deste nível é seu primeiro aviso de uma mudança estrutural no controle do mercado.
Por Que Esta Ferramenta Muda Seu Fluxo de Trabalho
Clareza Ponderada pelo Volume: Cada vela é calculada multiplicando a variação de preço pelo volume de ticks. Se um movimento ocorre com volume baixo, a vela RSI não o confirmará. Isso mantém você fora de movimentos "armadilha" que parecem bons no gráfico de preços, mas não têm sustentação.
Insights do Corpo da Vela: As linhas tradicionais do RSI são nervosas e irregulares. Nossas velas suavizadas por WMA mostram o "abertura" e "fechamento" do momentum. Se o corpo da vela RSI é grosso e sólido, a tendência está saudável. Se os pavios são longos, o momentum está esgotado.
Versatilidade Multi-Mercado: * Tendência: Use a faixa 65–80 para permanecer mais tempo em trades vencedores.
Faixa/Scalping: Use os corredores 35–65 para capturar rotações rápidas durante sessões de menor volatilidade, como a Ásia.
Evite a Armadilha do "Código de Barras": A maioria dos indicadores força você a adivinhar durante períodos de baixa volatilidade. Este indicador apresenta um efeito visual único de "Código de Barras" durante a consolidação. Quando as velas se apertam, achatam e ficam neutras, o indicador está dizendo que o "motor do mercado" está desligado. Este aviso visual evita que você entre em falsos rompimentos de baixo volume e seja "picado" quando não há dinheiro real por trás do movimento do preço.
Otimização Nativa para cTrader: Construído especificamente para a API C# com lógica de "Máximo de Velas Visuais" para garantir que sua plataforma permaneça responsiva, mesmo em gráficos de 1 minuto.
Pare de negociar com base em para onde o mercado pode ir. Comece a negociar com base em para onde o volume realmente está empurrando. Este indicador não é apenas sobre sinais—é sobre entender a energia interna do mercado.
Resumo
Avaliações de clientes
5 | 33 % | |
4 | 67 % | |
3 | 0 % | |
2 | 0 % | |
1 | 0 % |


