Descrição
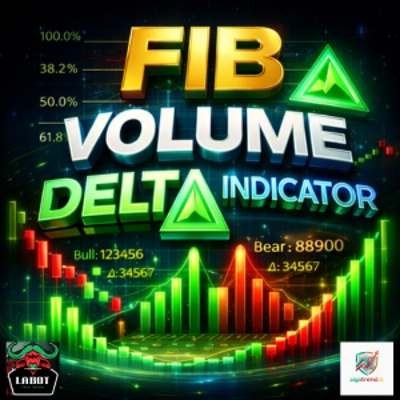
📊 Indicador Fib Volume Delta (GRÁTIS)
Fibonacci, Projeção & Delta de Volume Real para cTrader
🆓 Indicador Fib Volume Delta é um indicador profissional gratuito para cTrader, projetado para ajudar os traders a analisar retracements de Fibonacci, estrutura de mercado e delta de volume real de forma limpa e intuitiva.
Este indicador é a base do Fib Volume Delta Bot, fornecendo a mesma lógica em uma forma manual e visual.
📌 Para o Indicador (Análise Manual)
Aviso de Ferramenta Relacionada
Este indicador é a base analítica do Fib Volume Delta Bot, uma solução de negociação automatizada construída com a mesma lógica de Fibonacci e delta de volume.Enquanto o indicador é projetado para análise manual e suporte à decisão, o cBot transforma essa lógica em uma estratégia totalmente automatizada com gerenciamento avançado de risco e operações. https://ctrader.com/it/products//3006/?u=Labot
🔍 O QUE O INDICADOR FAZ
O indicador automaticamente:
✅ Detecta picos altos e baixos
✅ Desenha níveis chave de Fibonacci
✅ Calcula delta de volume real (volume de ticks de alta vs baixa)
✅ Projeta potenciais alvos de preço usando projeção de Fibonacci
✅ Funciona em Forex, Cripto, Índices
Sem repintura.
Sem volume simulado.
Sem confusão.
🧮 RECURSOS PRINCIPAIS
📐 Estrutura Fibonacci
- Detecção automática da faixa de preço atual
- Níveis de Fibonacci desenhados dinamicamente:
-
- 23,6%
- 38,2%
- 50,0%
- 61,8%
- 78,6%
- Lógica de alta ou baixa baseada na ordem dos swings
🔮 Projeção Fibonacci
- Linha de projeção opcional para estimar alvos futuros de preço
- Usa a mesma faixa de swing
- Ideal para:
-
- planejamento de take profit
- avaliação risco/recompensa
- análise de cenários
📊 Delta de Volume Real
- Calcula volume de ticks de alta vs baixa
- Exibe:
-
- Volume de alta
- Volume de baixa
- Delta (Alta − Baixa)
- Ajuda a identificar:
-
- absorção
- divergência
- força ou fraqueza por trás dos movimentos
⚠️ Usa volume real de ticks, não dados simulados.
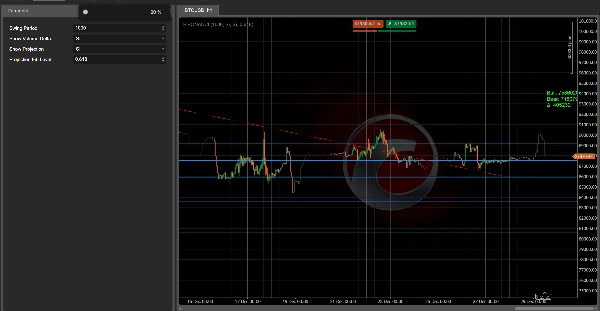
⚙️ EXPLICAÇÃO DOS PARÂMETROS
🧭 Detecção de Swing
- 🔢 Período do Swing
-
- Número de barras usadas para detectar o pico alto e o pico baixo
- Valor maior = estrutura mais estável
- Valor menor = estrutura mais reativa
📊 Delta de Volume
- 👁 Mostrar Delta de Volume
-
- Ativar / desativar o texto do delta de volume no gráfico
🔮 Projeção
- 📈 Mostrar Projeção
-
- Ativar / desativar projeção de Fibonacci
- 📐 Nível de Projeção Fib
🧠 COMO USÁ-LO
✔ Identifique zonas chave de retracement
✔ Confirme entradas com delta de volume
✔ Projete alvos realistas
✔ Combine com price action ou filtros de tendência
✔ Perfeito para negociação manual ou fluxos de trabalho semi-automatizados
🤖 FLUXO DE TRABALHO INDICADOR + BOT
Este indicador é a base visual e analítica do Fib Volume Delta Bot:
- 📊 Indicador → análise e confirmação
- ⚙️ cBot → execução, gerenciamento de risco e automação
Você pode:
- usar o indicador sozinho (negociação manual)
- ou combiná-lo com o cBot para automação completa
🆓 GRÁTIS & TRANSPARENTE
✔ Completamente GRÁTIS
✔ Sem funcionalidades bloqueadas
✔ Sem dependências externas
✔ Projetado para traders profissionais
⚠️ ISENÇÃO DE RESPONSABILIDADE
Este indicador não gera sinais por si só.
É uma ferramenta de suporte à decisão, destinada a ser usada com gerenciamento adequado de risco e contexto de mercado.
Resumo
Key features include dynamic Fibonacci level drawing based on current price ranges, real tick volume data (not simulated), and a clean, non-repainting interface. Users can customize swing detection sensitivity, toggle volume delta display, and enable or disable projection lines with selectable Fibonacci extension levels.
This indicator serves as the analytical foundation for the Fib Volume Delta Bot, an automated trading solution that applies the same logic for trade execution and risk management. It is intended as a decision-support tool to identify retracement zones, confirm entries with volume delta, and project realistic targets, suitable for manual or semi-automated trading workflows.