
説明
何をするか
Auto-Draw Fibonacci Suiteはスイング構造を自動検出し、7つの幾何学的ツールを同時に描画します—4つのフィボナッチツールと3つの補完的な幾何学的分析ツール—手動での配置は不要です。
従来のフィボナッチ分析では、スイングの特定、リトレースメントの描画、同じスイングからのファンの再描画、ピッチフォークの手動配置、タイムゾーンの調整が必要です。各ツールは別々の設定が必要で、新しいスイングが発生するたびにすべてを再描画しなければなりません。
このインジケーターはその全プロセスを自動化します。
スイングは回帰法により一度だけ検出されます。7つの幾何学的ツールすべて—フィボナッチのリトレースメント、エクスパンション、ファン、タイムゾーン、さらにアンドリュースピッチフォーク、等間隔チャネル、ギャンファン—は自動的に同じスイングポイントを参照します。
価格が新しいスイングを作成すると、すべてのアクティブなツールがリアルタイムで更新されます。再描画は不要です。手動でのスイング選択も不要です。異なるピボットをツール間で使うことによる幾何学的不整合もありません。
コアの利点
手動アプローチ:
- スイング高値とスイング安値を目視で特定する
- フィボナッチリトレースメントを描く
- 同じスイングを再度特定し、ファンを描く
- 3つのスイングを見つけ、ピッチフォークを手動で配置する
- 価格が新しいスイングを作成 → 全プロセスを繰り返す
Auto-Drawアプローチ:
- インジケーターがスイングを自動検出する
- 7つのツールすべてが自動で描画・更新される
- 価格が新しいスイングを作成 → すべて自動で更新される
- 違いは構造的です。7つの別々の手動ワークフローの代わりに、1つの自動検出システムがすべての幾何学的領域に投影します—比率分析のためのフィボナッチベースのツールと、包括的な市場構造マッピングのための3つの追加幾何学フレームワーク。
ツールスイート
4つのフィボナッチツール:
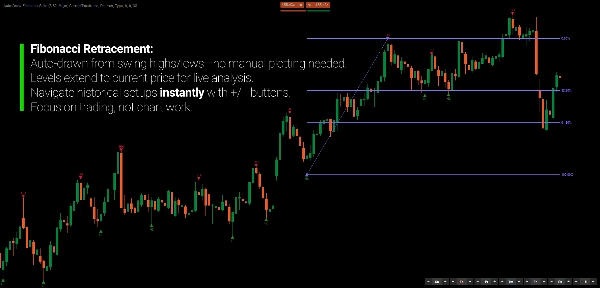
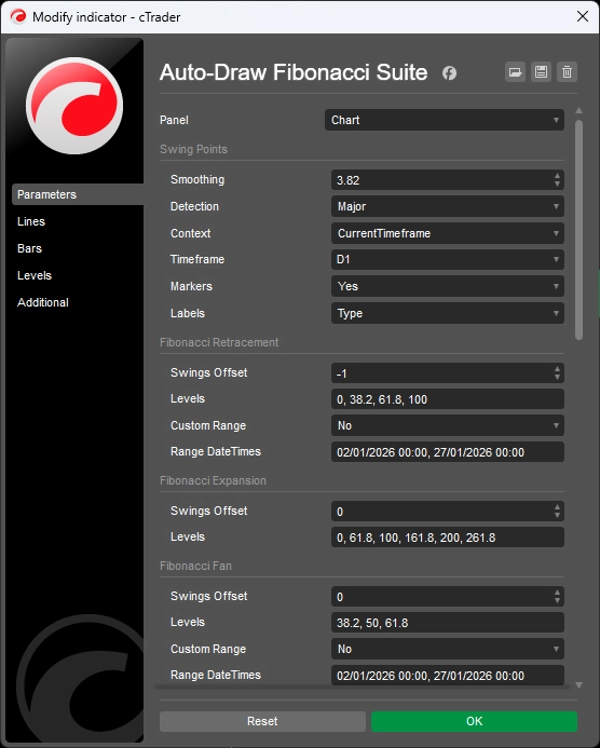
- フィボナッチリトレースメント — 水平レベル(0%、38.2%、61.8%、100%)
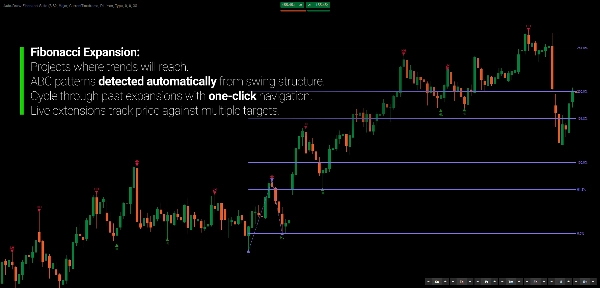
- フィボナッチエクスパンション — 3番目のスイングを超えた投影ターゲット
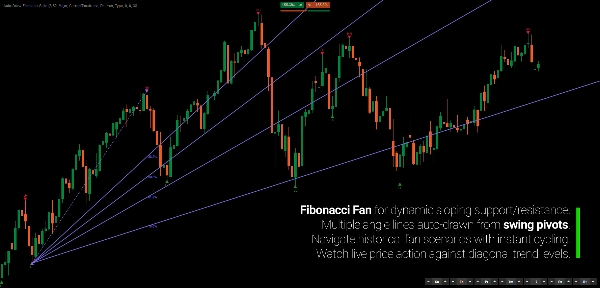
- フィボナッチファン — ピボットポイントからの斜めトレンドライン
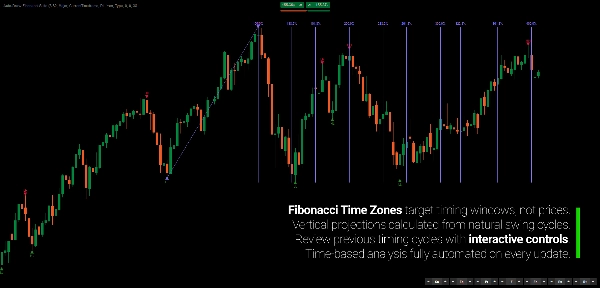
- フィボナッチタイムゾーン — 垂直の時間投影
3つの補完的な幾何学ツール:
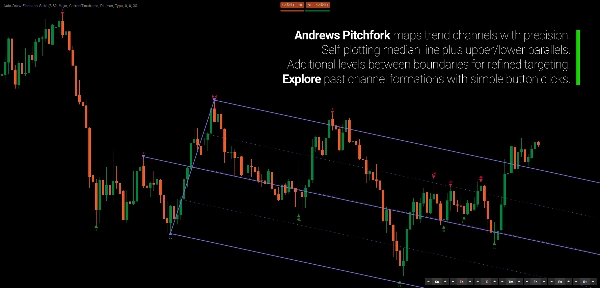
- アンドリュースピッチフォーク — 3点の中央値と平行チャネル
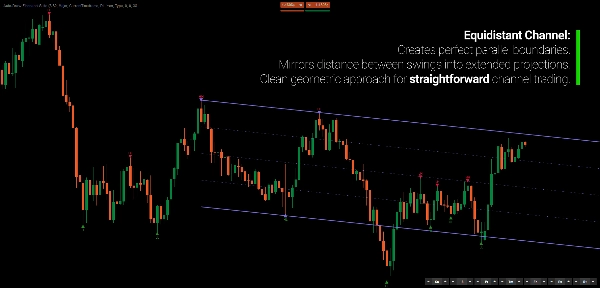
- 等間隔チャネル — 中間レベルを持つ平行チャネル
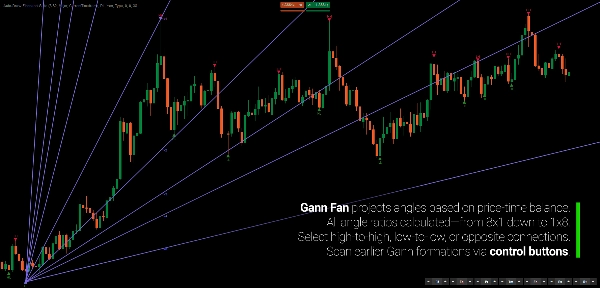
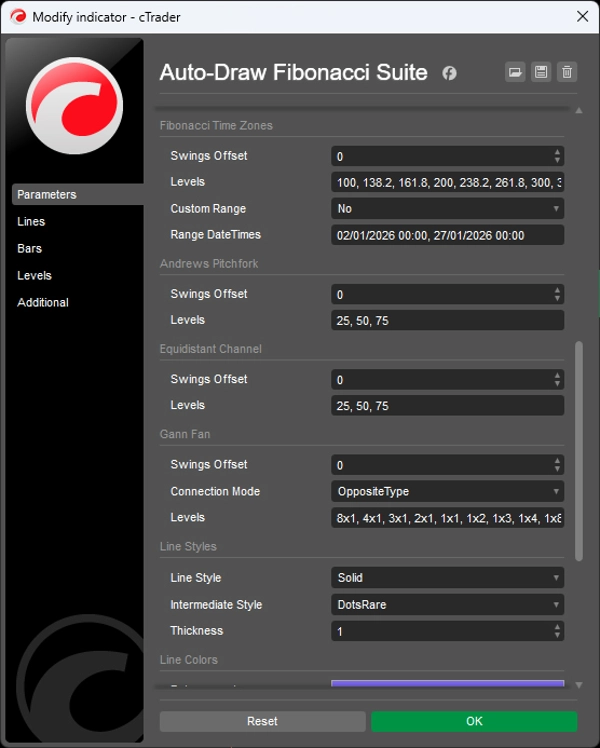
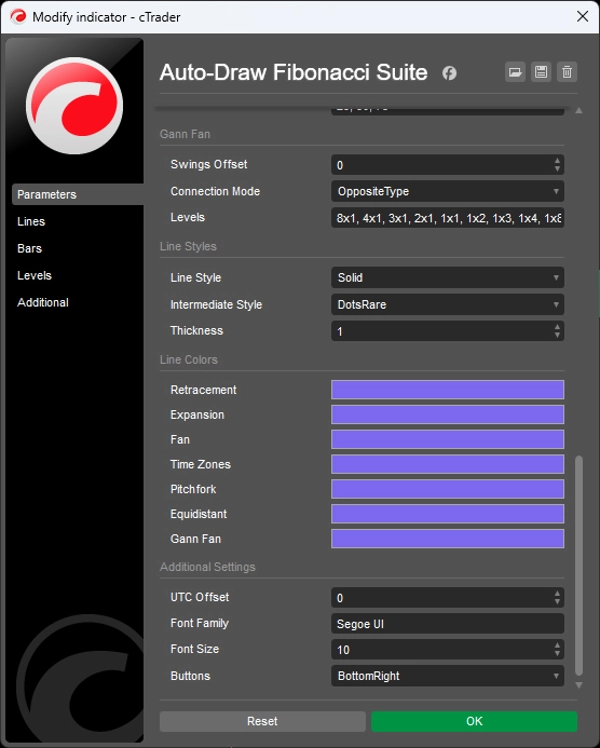
- ギャンファン — 価格対時間の角度投影(8x1、4x1、2x1、1x1、1x2…)
各ツールは独立して有効化できます。すべて同じ基礎となるスイング検出を参照しています。
統一されたスイング検出
3つの検出モードがスイング感度を制御します:
- メジャー — 少数で強力なスイング(終値で確認)
- スタンダード — バランスの取れた粒度(最も一般的)
- マイナー — トレンド内の内側スイングを検出(最大の詳細)
スイングは自動的に分類され(HH/LL/LH/HL)、深さ、ボリューム、期間で測定されます。視覚的マーカーは確認済みスイング(三角形)、未確認スイング(円)、内側スイング(四角形)を示します。
インタラクティブオフセットコントロール
7つのボタングループ(ツールごとに1つ)で、各幾何学的投影が使用する過去のスイングを即座に調整できます:
- 0 — 最新のスイング構造
- -1 — 前の構造
- -2 — 2つ前の構造
スイング履歴を遡って、過去の構造ポイントで幾何学的関係がどのように進化したかを確認できます。任意のツールの参照スイングを変更しても他のツールには影響しません。
マルチタイムフレーム対応
高いタイムフレームでスイング検出を適用しながら、低いタイムフレームのチャートを表示できます。日足のスイングとすべての幾何学的投影をH1チャート上で確認可能で、タイムフレームの切り替えは不要です。
主な特徴
- 回帰法による自動スイング検出
- 統一されたスイング参照から自動描画される7つの幾何学的ツール
- 新しいスイング形成時のリアルタイム更新
- 各ツールのインタラクティブオフセットコントロール
- マルチタイムフレームモード(日足分析、H1取引)
- 3つの検出モード(メジャー/スタンダード/マイナー)
- スイング分類(HH/LL/LH/HL)と指標
- スマートスインググルーピング(冗長な中間スイングを排除)
- 完全にカスタマイズ可能なレベル、色、スタイル
- アクティブツールのための強調表示されたソーススイング
対象ユーザー
このインジケーターは、フィボナッチや幾何学的分析ツールを理解しているが、手動での配置や再描画に時間をかけたくないトレーダー向けです。
複数のフィボナッチ投影を使い、価格の展開に合わせて常に再描画している場合、または手動配置が面倒で特定のツールを避けている場合、このスイートはそのワークフローを自動化します。
これはスイングトレーダーやポジショントレーダーで複数ツールにわたる幾何学的参照が必要な方、マルチタイムフレーム分析者で実行チャートに高タイムフレーム構造を求める方、そして裁量トレーダーで幾何学的合流を重視しつつ手動ツール管理の負担を避けたい方に適しています。
これはシグナルシステムではありません。フィボナッチや幾何学的な考え方を既に持ち、分析を自動更新したいトレーダーのための自動化ツールです。
何が違うのか
ほとんどの幾何学的分析インジケーターは1種類のツールだけを描画します。このスイートは統一されたスイング検出から7つを同時に描画します。
ほとんどは手動でスイングを選択する必要がありますが、これはスイングの特定を自動化し、すべてのツールをリアルタイムで更新します。
ほとんどは各ツールを独立して扱いますが、これはすべての投影が同じ基礎構造を参照することで幾何学的一貫性を維持します。
結果として、常時再描画なしで完全なマルチフレームワーク幾何学分析が可能です。
---
フィボナッチを幾何学的言語として理解する
フィボナッチ分析はしばしば予測的と誤解され、市場が特定の比率を「尊重」しているかのように考えられます。これは基本原則を見落としています。
フィボナッチ比率は価格の行き先を予測しません。過去の構造に対する価格の動きを記述するための標準化された幾何学的語彙を提供します。61.8%へのリトレースメントは、現在の調整と以前のインパルスとの幾何学的関係を表し、因果的な意味での「サポート」ではありません。
価値は個々のレベルではなく幾何学的一貫性にあります。複数の投影が収束すると—リトレースメントレベルがファン角度やタイムゾーンと一致すると—その収束は異なる測定領域間の構造的一貫性を反映します。
市場はフィボナッチレベルを目標にしません。幾何学的投影が一致すると、その一致は基礎となる構造的秩序を明らかにします。これが孤立したレベルの価値が限定的であり、収束する幾何学的構造がしばしば転換点を示す理由です。
幾何学は原因ではなく、構造的関係の記述言語です。
---
取引にはリスクが伴います。このインジケーターはテクニカル分析ツールです—常に適切なリスク管理を行ってください。


![「[Stellar Strategies] Inside Bar with Signals」ロゴ](https://cdn.ctrader.com/image/webp/1d9e8bfa-3b2c-4440-bb37-5856902008a7_30683)


