
Descrição
MainChart_EMA_BB_PSAR
Como Funciona
1. Conceito Principal
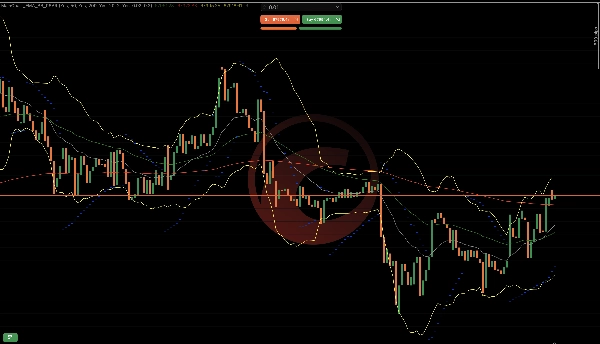
Este indicador combina lógica de tendência, volatilidade e continuação de momentum em uma única sobreposição:
EMA 50 & EMA 200 → Direção da tendência
Bandas de Bollinger → Volatilidade & expansão
Parabolic SAR → Continuação da tendência & tempo de reversão
Cada componente tem uma função específica. Juntos, formam uma estrutura de decisão organizada.
2. Lógica EMA (Motor de Tendência)
O Que Faz
Calcula médias exponenciais dos preços de fechamento.
EMA 50 reage mais rápido.
EMA 200 reage mais devagar.
Como Interpreta o Mercado
Significado da Condição
EMA 50 acima da EMA 200 Tendência de alta
EMA 50 abaixo da EMA 200 Tendência de baixa
EMA 50 cruza a EMA 200 Possível mudança de tendência
Por Que Funciona
EMA suaviza o preço e filtra ruídos.
A relação 50/200 mostra o momentum de curto prazo relativo à direção de longo prazo.
3. Lógica das Bandas de Bollinger (Motor de Volatilidade)
O Que Faz
Calcula média móvel (banda do meio)
Constrói bandas superior/inferior usando desvio padrão
Como Interpreta o Mercado
Significado da Condição
Bandas estreitas Baixa volatilidade (compressão)
Bandas se expandem Alta volatilidade (movimento forte ativo)
Preço toca banda externa Potencial excesso de extensão
Por Que Funciona
Os mercados ciclam entre compressão e expansão.
Rompimentos frequentemente ocorrem após contração de volatilidade.
4. Lógica do Parabolic SAR (Motor de Continuação)
O Que Faz
Plota pontos acima ou abaixo do preço.
Acelera conforme a tendência continua.
Como Interpreta o Mercado
Significado da Posição do Ponto
Abaixo do preço Tendência de alta ativa
Acima do preço Tendência de baixa ativa
Ponto inverte Possível reversão
Por Que Funciona
PSAR se ajusta conforme a tendência amadurece, ajudando a seguir movimentos e detectar exaustão.
5. Como Todos os Componentes Funcionam Juntos
Estrutura de Alta
EMA 50 acima da EMA 200
Preço acima da EMA 50
PSAR abaixo das velas
Bandas de Bollinger se expandindo para cima
→ Indica forte momentum de alta
Estrutura de Baixa
EMA 50 abaixo da EMA 200
Preço abaixo da EMA 50
PSAR acima das velas
Bandas de Bollinger se expandindo para baixo
→ Indica forte momentum de baixa
6. Detecção de Fase do Mercado
Este indicador ajuda a identificar 3 fases do mercado:
Fase de Tendência
EMA alinhadas
PSAR consistente
Bandas se expandindo
Melhor para operações de continuação.
Fase de Compressão
Bandas apertadas
EMA plana
PSAR invertendo frequentemente
Melhor esperar por um rompimento.
Fase de Transição
Cruzamento de EMA formando
Inversão do PSAR
Bandas se alargando
Potencial reversão precoce.
7. Exemplo Prático de Fluxo
Sequência de alta exemplo:
Bandas se comprimem
Vela forte de alta rompe a banda superior
EMA 50 cruza acima da EMA 200
PSAR inverte abaixo do preço
Esta sequência mostra:
Expansão de volatilidade
Confirmação de tendência
Suporte à continuação
8. O Que NÃO Faz
Não prevê notícias
Não garante reversões
Não mede fluxo de ordens
Não elimina falsos rompimentos
Fornece confirmação estruturada, não certeza.
9. Modelo Resumido da Lógica
Filtro de Tendência → EMA
Gatilho de Volatilidade → Bandas de Bollinger
Tempo & Trailing → Parabolic SAR
Juntos, reduzem entradas aleatórias e melhoram a tomada de decisão estruturada.
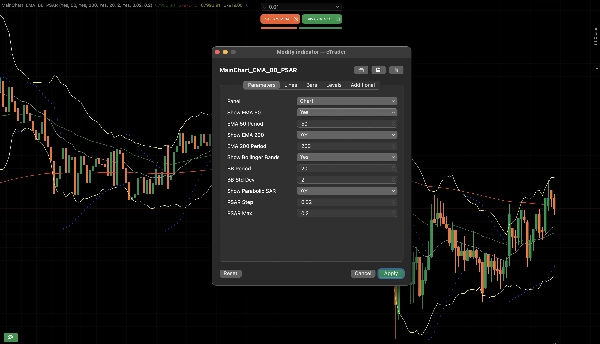
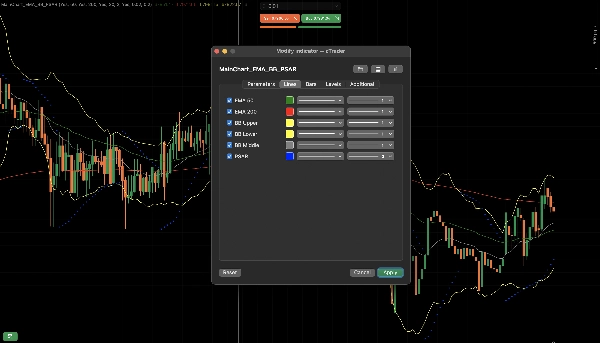
O bom deste indicador é que é configurável e não há necessidade de configurar múltiplos indicadores.
Resumo
Avaliações de clientes
5 | 50 % | |
4 | 50 % | |
3 | 0 % | |
2 | 0 % | |
1 | 0 % |


![Logótipo de "Smart Money Concepts (SMC) [Iridio Capital]"](https://cdn.ctrader.com/image/webp/28b69fd1-ef54-4bed-9487-07e78e883be4_40934)


