present
Registrieren Sie sich und erhalten Sie $50 Rabatt auf Ihren ersten Kauf
Trading product for AW Multi Data Indikator, image 1
AW Multi Data
5.62K
Kostenlose Installationen

Beschreibung

Zusammenfassung

KI-Zusammenfassung
AW Multi Data is a trading indicator that displays key trading metrics directly on your chart. It shows the current symbol and timeframe, daily net profit percentage, daily net profit amount, and spread. The indicator requires the timezone to be set to UTC to accurately reflect daily profit values. This tool provides real-time performance data to assist traders in monitoring their trades within the charting interface.
Indikatorprofil

Diskussion

Kundenbewertungen

0.0
Bewertungen: 0
Kundenbewertungen
Bisher gibt es keine Bewertungen für dieses Produkt. Haben Sie es schon ausprobiert? Dann können Sie die erste Person sein, die andere darüber informiert!

Häufig gestellte Fragen (FAQ)

Über den cTrader Store verfügbare Produkte, einschließlich Handelsbots, Indikatoren und Plugins, werden von externen Entwicklern bereitgestellt und nur zu Informations- und technischen Zugriffszwecken verfügbar gemacht. cTrader Store ist kein Broker und erbringt keine Anlageberatung, persönlichen Empfehlungen oder eine Garantie für zukünftige Performance.

Mehr von diesem Autor

with this indicator you could see other time frame candle in your chart.
show spread on chart
some user add moving average to macd to see better. in ctrader 4.3.11 there is a problem with this . I make a macd tha
this indicator show macd on chart.
Multi Time Frame Moving Average is a powerful and flexible indicator for cTrader
 this moving include everything that a trader needs from Moving Average.
this indicaotr show distance between Tenkan to Kijun, Close to Kijun and Close to Tenkan 
Add Slowing to IR Moving Average.
IR Candle Open plots customizable opening price lines for daily, weekly, and monthly candles
Coral indicator
you could put your check list in your chart you could split your test with “,” you could put your checklist in indicat
this indicator show other time frame close in lower time frame. for ex: show daily close in m 15.

Das könnte Sie auch noch interessieren

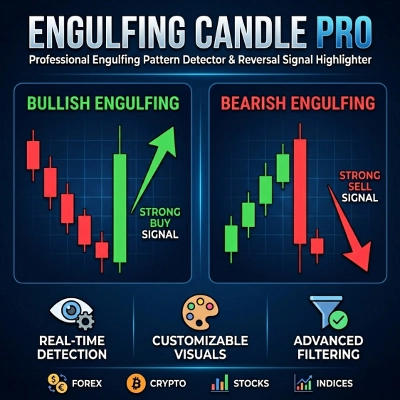
Auto-detects Bullish/Bearish Engulfing patterns to spot trend reversals. Real-time alerts, custom colors, all symbols.
An indicator that accurately shows the trend direction. A vital tool for clear trading decisions.
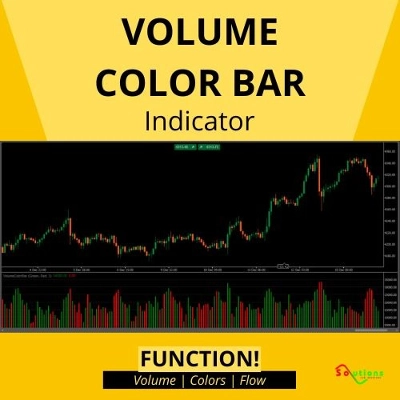
Color Volume Bars – Visualize Market Strength Instantly
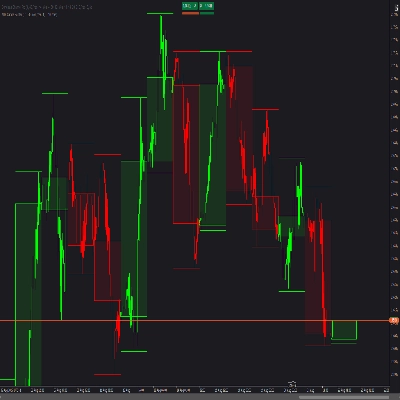
Overlay HTF context on any chart: color bars by HTF and draw filled HTF bodies with optional High/Low lines.
Map market structure, order blocks, liquidity and key zones with an interactive cTrader dashboard.
The Mean Reversion Indicator is designed to identify potential reversal points in the market.
Detects breakouts 📈 auto-draws levels 🚀 confirms trends 🐻 dynamic signals 🎨 customizable for any asset & timeframe.
Strong Supertrend Turn Market Movement into a Clear Map Market analysis
(ViPi) MTF Candle displays multiple higher timeframe candles right on your current chart for ultimate trend analysis.
Institution-level trend Analyzer.
SuperTrend signals scored on five confluence factors, with an ATR stop, three targets and a dashboard.
Candle Timer best used for Scalper
An advanced VWAP with multi-VWAP (Daily/Weekly/Monthly/Anchored), click-to-anchor, configurable alerts, a stats panel,
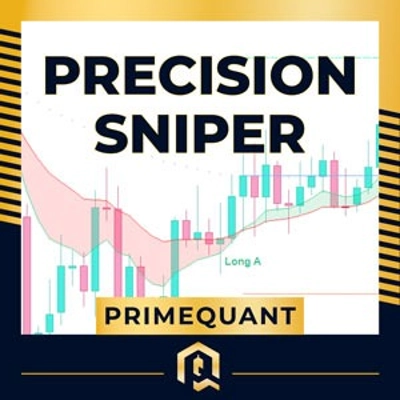
Precision Sniper by PrimeQuant: Advanced confluence engine with auto-presets, dynamic TP/SL, and live backtest stats.
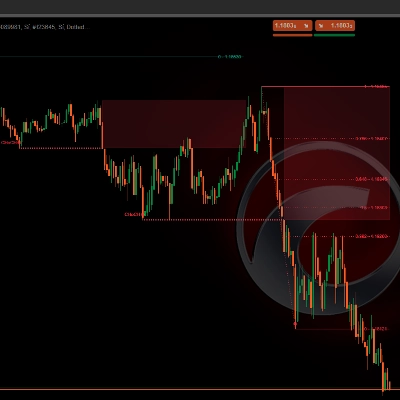
PRO Liquidity Sweep + FVG Combo detector with custom Gold/Blue signals & alerts
Detects CHoCH breakouts, draws interest zones & auto Fibo. Built for Smart Money & Price Action Engulfing confirmation
Opening ranges, dynamic trend channels, and multi-scale breakout/retest analysis for clear intraday chart decisions.
Angora Pattern Recognition is a cTrader indicator that finds, draws and tracks classic chart patterns automatically.

Preis

5.62K
Kostenlose Installationen