

Beschreibung
Pinescriptlabs Store Indikatoren: Pinescriptlabs Store cBots : (cBot) Gold & BTC BreakoutSession Pivots(neu)
PRICE ACTION (Neu)
Trailing Smart Algorithm (Neu)
Vorhersage basierend auf Linreg & ATR
SmartTrend Unterstützung &
Widerstand
Linien
Dynamische
Marktstruktur
Analyse
von
Wendepunkten
Punkten
Fibonacci
Lineare
Regression
Multi-Zeitrahmen
Mehrstufiger
Kerzen-Bias
Tracker
Reaktive gleitende Durchschnittslinie
Auto
Unterstützung und
Widerstand
Trend
Linien
Alle
Unterstützungs- und
Widerstandsniveaus
Levels
Beschreibung:
Fortgeschrittenes HTF Trend Kauf- & Verkauf-Handelssystem
Was ist es und wofür ist es?
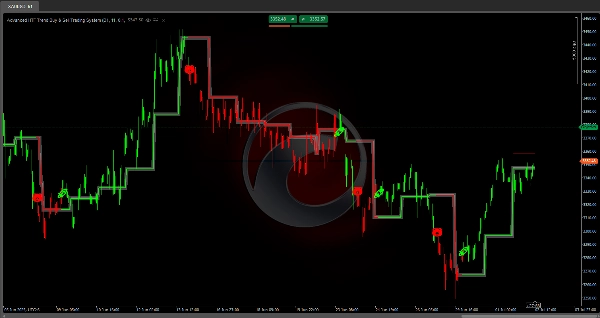
Es ist ein technischer Analysealgorithmus, der automatisch Unterstützungs- und Widerstandsniveaus 📈 basierend auf historischen Preisbereichen identifiziert und erkennt, wann der Preis diese Niveaus durchbricht, um Trendsignale 💡 zu generieren.
Wie funktioniert die Logik?
1️⃣ Bereichsberechnung
Der Indikator analysiert einen definierten historischen Zeitraum (vollständig konfigurierbar), um zu finden:
• Den höchsten Preis, der in diesem Zeitraum erreicht wurde 📊
• Den niedrigsten Preis, der in diesem Zeitraum erreicht wurde 📉
• Den Mittelpunkt zwischen beiden Niveaus ⚖️
2️⃣ Niveauberechnung
Sobald die Extremwerte identifiziert sind, zeichnet der Indikator:
• Eine rote Linie auf dem maximalen Niveau (Widerstand)
• Eine grüne Linie auf dem minimalen Niveau (Unterstützung)
• Fügt jedem Niveau einen Sicherheitsabstand hinzu, um Fehlalarme zu vermeiden 🛡️
3️⃣ Breakout-Erkennung
Das System überwacht ständig den Preis, um zu erkennen:
• Bullischer Ausbruch 🚀: wenn der Preis über dem Widerstandsniveau + Puffer schließt
• Bärischer Ausbruch 🐻: wenn der Preis unter dem Unterstützungsniveau - Puffer schließt
4️⃣ Bestätigungssystem
Bevor ein endgültiges Signal generiert wird ✅, wartet der Indikator:
• Auf eine konfigurierbare Anzahl aufeinanderfolgender Kerzen, die den Ausbruch bestätigen ⏳
• Erst nach der Bestätigung ändert er offiziell den Trend
5️⃣ Dynamische Aktualisierung
Niveaus werden automatisch neu berechnet:
• Wenn ein neuer Zeitraum beginnt (täglich, wöchentlich oder monatlich, je nach Einstellung) 🔄
• Linien erstrecken sich, bis neue Niveaus gesetzt werden
• Die Mittellinie ändert die Farbe entsprechend dem aktuellen Trend
Wie benutzt man das ?
✨ Signale:
• Kaufen: Das 🚀 Symbol erscheint, wenn ein bullischer Ausbruch bestätigt wird
• Verkaufen: Das 🐻 Symbol erscheint, wenn ein bärischer Ausbruch bestätigt wird
🎨 Kerzenfärbung:
• Kerzen werden automatisch entsprechend dem aktuellen Trend eingefärbt:
✅ Grün: Aktiver bullischer Trend
❌ Rot: Aktiver bärischer Trend
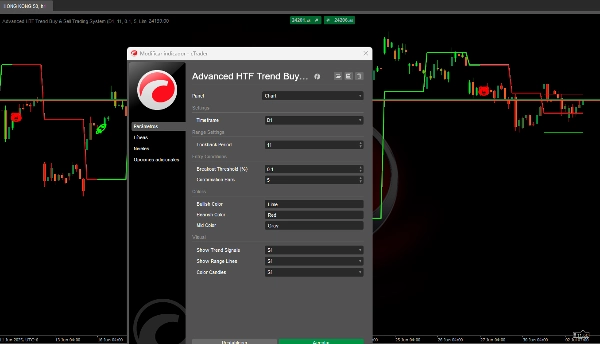
Parameter Einstellungen
🔧 Lookback-Periode (5–200, Standard: 11)
Was steuert es?
Die Anzahl der historischen Kerzen, die zur Berechnung von Hochs und Tiefs verwendet werden.
Auswirkungen bei Änderung:
• Niedrige Werte (5–15):
- Reaktivere und häufigere Niveaus
- Höhere Anzahl von Signalen
- Am besten für Scalping und kurzfristige Trades
- Ideal für hochvolatile Märkte
• Hohe Werte (30–50):
- Stabilere und langlebigere Niveaus 🏛️
- Weniger, aber zuverlässigere Signale
- Besser für Swing Trading und mittelfristige Positionen
- Ideal für stabilere Märkte
📏 Breakout-Schwelle (0,01–5,0%, Standard: 0,1%)
Was steuert es?
Der zusätzliche Puffer, den der Preis überschreiten muss, um einen Ausbruch zu bestätigen.
Auswirkungen bei Änderung:
• Niedrige Werte (0,05–0,15%):
- Frühere und sensiblere Signale 🔍
- Höheres Risiko von Fehlausbrüchen
- Ideal für Forex Majors mit niedrigen Spreads
- Am besten für Märkte mit hoher Liquidität
• Hohe Werte (0,3–1,0%):
- Spätere, aber zuverlässigere Signale 🛡️
- Geringeres Risiko von Marktrauschen
- Ideal für Kryptowährungen und volatile Assets
- Am besten für Märkte mit größeren Spreads
⏳ Bestätigungs-Kerzen (1–5, Standard: 1)
Was steuert es?
Wie viele aufeinanderfolgende Kerzen den Ausbruch bestätigen müssen, bevor ein Signal generiert wird.
Auswirkungen bei Änderung:
• 1 Kerze:
- Sofortige Signale ⚡
- Mehr Handelsmöglichkeiten
- Höheres Risiko von vorzeitigen Signalen
- Ideal für aktive Trader
• 2–3 Kerzen:
- Balance zwischen Geschwindigkeit und Zuverlässigkeit ⚖️
- Reduziert Fehlalarme deutlich
- Ideal für die meisten Strategien
• 4–5 Kerzen:
- Sehr konservative Signale 🕊️
- Maximale Zuverlässigkeit
- Kann frühe Chancen verpassen
- Ideal für langfristige Positionen
📊 Optimierung nach Asset-Typ
💱 Forex Majors (EUR/USD, GBP/USD, etc.)
• Lookback: 15–25
• Schwelle: 0,05–0,15%
• Bestätigung: 1–2 Kerzen
💰 Kryptowährungen
• Lookback: 10–20
• Schwelle: 0,2–0,8%
• Bestätigung: 2–3 Kerzen
📈 Aktienindizes
• Lookback: 20–30
• Schwelle: 0,1–0,3%
• Bestätigung: 1–2 Kerzen
🌾 Rohstoffe
• Lookback: 25–35
• Schwelle: 0,15–0,4%
• Bestätigung: 2–3 Kerzen
Überlegungen
• Kann in sehr schnelllebigen Märkten 🏃♂️ späte Signale erzeugen
• Weniger effektiv in extrem seitwärts gerichteten Märkten
• Erfordert Parameteranpassungen je nach Asset und Zeitrahmen ⏱️
Zusammenfassung
The system continuously monitors price action to detect bullish breakouts (price closing above resistance plus buffer) and bearish breakouts (price closing below support minus buffer). It includes a confirmation mechanism that waits for a configurable number of consecutive bars confirming the breakout before officially signaling a trend change. The midpoint line changes color to reflect the current trend, and all levels update dynamically at the start of new periods (daily, weekly, or monthly).
Signals are visually indicated with symbols: a rocket (🚀) for confirmed bullish breakouts and a bear (🐻) for confirmed bearish breakouts. Candles are colored green for active bullish trends and red for bearish trends.
Key adjustable parameters include lookback period (5–200 bars), breakout threshold buffer (0.01–5.0%), and confirmation bars (1–5). These settings can be optimized for various asset types such as Forex majors, cryptocurrencies, stock indices, and commodities, balancing signal frequency, reliability, and market conditions. The indicator supports multiple timeframes and is suitable for scalping, swing trading, and longer-term strategies depending on configuration.


![„[Stellar Strategies] Market Session Ultimate“-Logo](https://cdn.ctrader.com/image/webp/61ffd537-0125-4246-9e72-42eca1791d64_28232)