Descrição
Perfil de Liquidez e Absorção das Baleias
Rastreie dinheiro institucional, analise o fluxo de ordens e identifique zonas de reversão com precisão volumétrica
O Perfil de Liquidez e Absorção das Baleias não é seu perfil de volume tradicional. É um conjunto de análise de microestrutura de mercado que detalha cada transação para mostrar não apenas onde o volume foi negociado, mas quem negociou (institucional vs. varejo) e como o preço interagiu nesses níveis (agressão vs. absorção).
Ele possui um motor de renderização otimizado que projeta todos os dados à direita do preço atual, mantendo seu gráfico completamente limpo e sem atrasos.
Principais Recursos
- Filtro de Força (Apenas Baleias): Usa um algoritmo percentil (ex.: top 97%) para separar o volume institucional ("Forte") do volume de varejo ("Fraco"). Você pode ativar o modo "Apenas Forte" para rastrear exclusivamente a pegada do dinheiro inteligente.
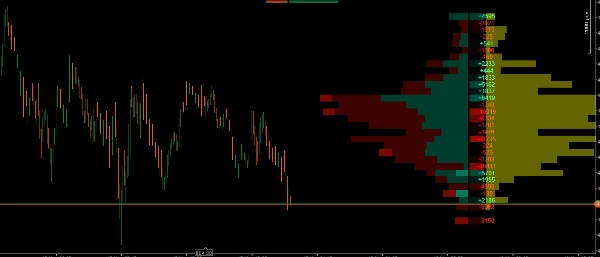
- Perfil de Volume Empilhado: Exibe visualmente a distribuição do volume de alta e baixa por nível de preço, facilitando a identificação do Ponto de Controle (POC) e dos Nós de Alto/Baixo Volume (HVN/LVN).
- Detecção Automática da Área de Valor: Destaca os níveis de preço onde a maior porcentagem do volume foi negociada (padrão 70%), atenuando as zonas externas para facilitar a leitura do contexto do mercado rapidamente.
- Perfil Delta (Mapa de Calor): Calcula a diferença exata entre compras e vendas de mercado em cada nível de preço. Inclui valores numéricos e um mapa de calor visual para identificar rapidamente quem está agressivamente no controle.
- Perfil de Absorção (Zonas Amarelas): Mede o volume preso especificamente dentro dos pavios dos candles. Isso permite que você veja graficamente exatamente onde o dinheiro inteligente está absorvendo passivamente a liquidez dos traders de varejo presos.
- Desempenho Otimizado: Cálculos volumétricos pesados são processados apenas no candle mais recente, garantindo que sua plataforma cTrader funcione de forma suave e eficiente, mesmo em timeframes menores.
Como usar este indicador em sua negociação?
Este indicador fornece 3 camadas de confirmação para suas operações. Veja como combiná-las efetivamente:
1. Defina o Contexto com o Perfil de Volume e a Área de Valor
- Use o perfil de volume para identificar onde a aceitação do preço é maior (Área de Valor e POC).
- Estratégia: Procure oportunidades de compra na parte inferior da Área de Valor (Suporte) e oportunidades de venda na parte superior da Área de Valor (Resistência).
2. Avalie a Agressão com o Perfil Delta
- Quando o preço atingir seu nível chave (ex.: uma zona de suporte), observe a coluna Delta.
- Estratégia: Se você busca uma compra no suporte, deseja ver um Delta fortemente positivo (verde) nesse nível, indicando que compradores estão entrando agressivamente. Se o Delta permanecer fortemente negativo, os vendedores ainda dominam.
3. Encontre o Gatilho Perfeito com o Perfil de Absorção (O núcleo do indicador)
- É aqui que a ferramenta realmente brilha. Frequentemente, o mercado parece estar caindo forte (Delta negativo forte), mas o preço para de cair. Por quê? Porque as "baleias" estão usando ordens limitadas para absorver toda essa pressão de venda.
- Estratégia (Operação de Reversão): Se você vê o preço caindo para um nível crítico e o Delta está negativo (vendedores de varejo presos), mas de repente aparece uma grande barra amarela no Perfil de Absorção, significa que as instituições acabaram de absorver toda a liquidez naquele pavio. Este é seu gatilho ideal para entrar na direção oposta!
4. Use o "Filtro de Força" para Cortar o Ruído
- Se o mercado estiver consolidando e a direção não estiver clara, ative a opção "Apenas Forte". Isso ocultará todo o ruído irrelevante do varejo e mostrará exatamente onde grandes fundos estão acumulando ou distribuindo suas posições.
Resumo
A Delta Profile heatmap calculates the net difference between market buys and sells at each price level, showing buyer or seller aggression. The Absorption Profile identifies volume trapped in candlestick wicks, revealing where institutional traders absorb liquidity from retail participants. The indicator’s optimized engine processes heavy volumetric calculations only on the latest candle, ensuring smooth performance on the cTrader platform.
Traders can use this tool to define market context, evaluate buying or selling aggression, and pinpoint reversal triggers based on absorption patterns. The "Strong Only" mode filters out retail noise during consolidation phases, focusing on institutional accumulation or distribution zones. This indicator supports volume and DOM data visualization to enhance decision-making around key support and resistance levels.
Avaliações de clientes
5 | 100 % | |
4 | 0 % | |
3 | 0 % | |
2 | 0 % | |
1 | 0 % |