
คำอธิบาย
ปลดล็อกการเทรดที่แม่นยำด้วยเทคโนโลยีติดตามแนวโน้มปฏิวัติของเรา
BrickAlgo TrendTracker คืออินดิเคเตอร์ระบุแนวโน้มขั้นสูงสุดที่ออกแบบมาเฉพาะสำหรับ cTrader เครื่องมือทางเทคนิคที่ทรงพลังนี้ช่วยให้คุณจับจุดกลับตัวของตลาดได้อย่างง่ายดาย พร้อมสัญญาณภาพที่ชัดเจนสำหรับจุดเข้าและออกที่เหมาะสมที่สุด
คุณสมบัติหลัก:
- การตรวจจับแนวโน้มแบบไดนามิก: ระบุการเปลี่ยนแปลงแนวโน้มโดยอิงจากการวิเคราะห์การเคลื่อนไหวของราคา
- ระบบสัญญาณภาพ: ลูกศรที่มีสีแสดงการเปลี่ยนแปลงแนวโน้มขาขึ้นและขาลง
- การติดตามประสิทธิภาพ: การแสดงค่าพิปแบบเลือกได้แสดงกำไร/ขาดทุนระหว่างสัญญาณ
- การตั้งค่าที่ปรับแต่งได้: ปรับพารามิเตอร์ให้ตรงกับสไตล์การเทรดและกรอบเวลาของคุณ
- อินเทอร์เฟซแผนภูมิที่สะอาดตา: การออกแบบแบบซ้อนทับช่วยให้แผนภูมิของคุณไม่รก
วิธีการทำงาน:
BrickAlgo TrendTracker วิเคราะห์การเคลื่อนไหวของราคาโดยเปรียบเทียบค่าปัจจุบันกับค่าเฉลี่ยที่ปรับเรียบของราคาสูงและต่ำ เมื่อมีการเปลี่ยนแปลงรูปแบบที่สำคัญถูกตรวจพบ อินดิเคเตอร์จะสร้างสัญญาณ ช่วยให้คุณระบุจุดกลับตัวของแนวโน้มที่อาจเกิดขึ้นก่อนที่ผู้เทรดคนอื่นจะเห็นได้ชัด
นี่คือคำอธิบายสั้น ๆ เกี่ยวกับวิธีใช้ตัวบ่งชี้:
- โหลดอินดิเคเตอร์: เพิ่มอินดิเคเตอร์ลงในแผนภูมิของคุณจากเมนูอินดิเคเตอร์ใน cTrader.
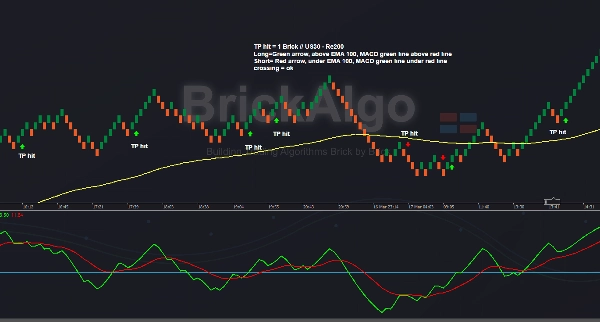
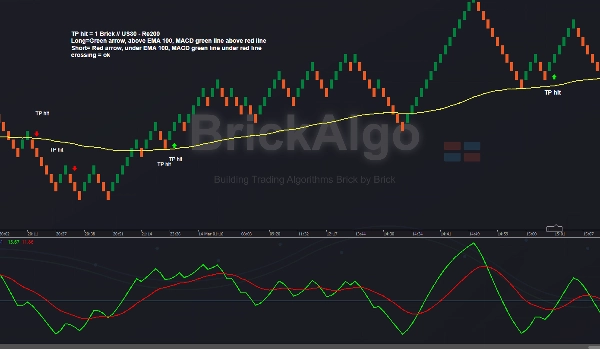
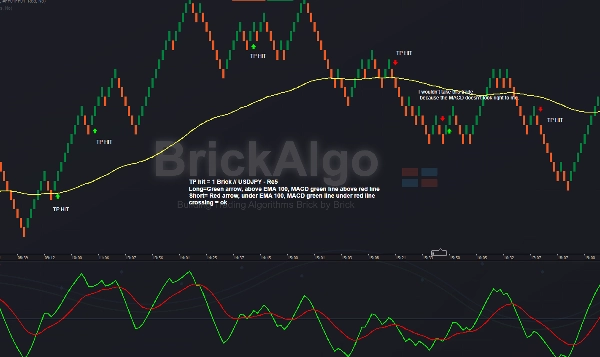
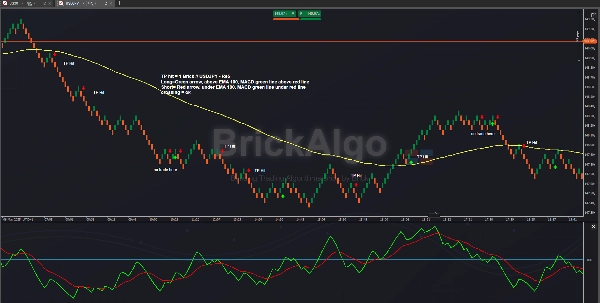
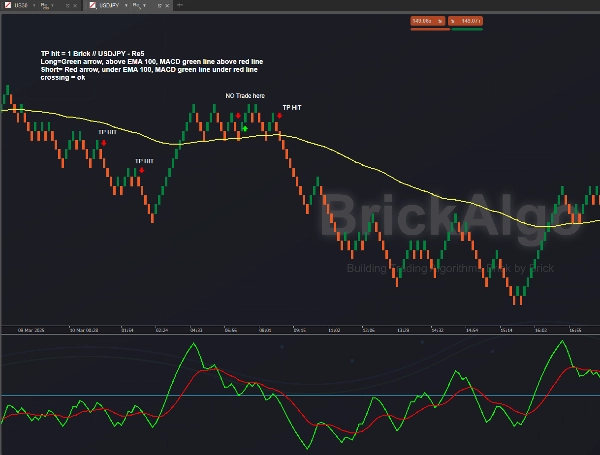
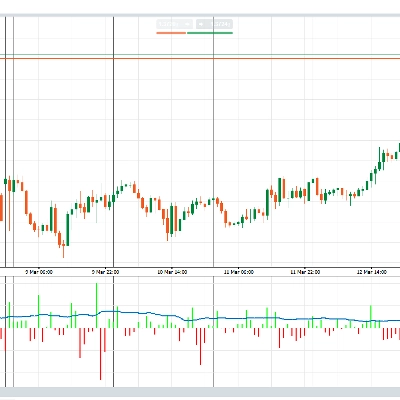
- ใช้แผนภูมิ Renko (เช่น Re5): ตรวจสอบให้แน่ใจว่าคุณใช้แผนภูมิ Renko เช่น Re5 ซึ่งเป็นเพียงตัวอย่าง อินดิเคเตอร์ทำงานกับขนาดบล็อกที่แตกต่างกัน โดยส่วนตัวผมเทรด USDJPY บน Re5 และ US30 บน Re100 และ Re200 ด้วยอินดิเคเตอร์นี้.
- ปรับการตั้งค่า: ดูภาพหน้าจอที่ให้ไว้สำหรับการตั้งค่าอินดิเคเตอร์ที่แนะนำ.
- กรองสัญญาณ: เพื่อการยืนยันการเทรดที่ดียิ่งขึ้น ใช้ MACD ตามที่แสดงในภาพหน้าจอ, การยืนยัน HTF, แนวรับ & แนวต้าน, EMA หรืออินดิเคเตอร์ BrickAlgo อื่น ๆ เช่น BrickAlgo TrendPulse.
- TP & SL: ผมใช้ ขนาดบล็อก 1 ก้อน สำหรับทำกำไร (TP) ขณะที่จุดหยุดขาดทุน (SL) มีความยืดหยุ่น โดยปกติอยู่ระหว่าง 1 ถึง 3 ก้อน.
ผมชอบเทรด USDJPY บนแผนภูมิ Re5 และใช้ EMA 100 และ MACD ตามที่แสดงในภาพหน้าจอ ผมใช้ BrickAlgo TrendPulse เพื่อทำการเทรดเพิ่มเติม.


!["[CB] Pivot Points Pro" โลโก้](https://cdn.ctrader.com/image/webp/43463c82-67b0-4f10-a4ba-901bba091d81_32594)


