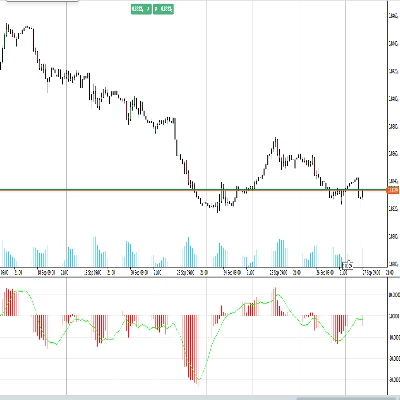
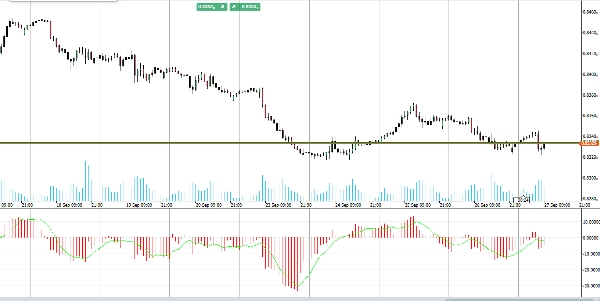
Indicador
NAS100
NZDUSD
XAUUSD
Commodities
Forex
EURUSD
GBPUSD
BTCUSD
Indices
Prop
Stocks
Crypto
USDJPY
RT Time Segmented Volume
Logótipo de "RT Time Segmented Volume"
25/09/2025
Desktop
Since 25/09/2024
Vendas
20
Imagem carregada de "RT Time Segmented Volume"Imagem carregada de "RT Time Segmented Volume"

Introducing the Time Segmented Volume (TSV) indicator, designed to enhance your trading strategy with deeper insights into volume flow and price trends.

The TSV indicator measures the relationship between price and volume over a specified time period, helping you identify accumulation and distribution phases in the market.

Identify used to identify trends in stock prices, pinpoint support and resistance levels, and decode trading signals.

Perfect for traders seeking to refine their analysis and improve their decision-making, the TSV indicator offers a powerful tool for understanding market dynamics.

Upgrade your trading toolkit with the Time Segmented Volume indicator for superior trading performance.

Mais deste autor
Indicador
NAS100
NZDUSD
XAUUSD
+11
RT VWAP
Unlock VWAP in cTrader! Choose anchor periods, price sources, and display deviation bands with real-time tick updates.
RT TradingView ATR
Upgrade to ATR-RMA! Experience the precise ATR using Relative Moving Average for accurate volatility analysis in cTrader
Indicador
NAS100
Indices
NZDUSD
+9
RT True Strength Index
Enhance trading with TSI! Use the True Strength Index for clear insights into market momentum and trend strength.
Indicador
Indices
RSI
XAUUSD
+9
RT Stochastic RSI PRO
Unlock Stochastic RSI PRO in cTrader! Overlay RSI, highlight zones, and identify divergences with customizable settings.
Indicador
NAS100
NZDUSD
XAUUSD
+10
RT Standard Deviation Channel_noSourceCode
Visualize trends with Standard Deviation Channel! Display median, and add customizable upper/lower deviation channels.
Indicador
NAS100
Indices
NZDUSD
+9
RT Relative Moving Average
Bring the RMA to cTrader! This is the Relative Moving Average from TradingView.
Indicador
NAS100
NZDUSD
XAUUSD
+12
RT Bollinger Bands Cloud
Visualize Bollinger Bands with a colored cloud for clarity. Enhance your trading precision with this dynamic indicator!
Também poderá gostar de
Indicador
RSI
MACD
SmartBot-MACD & RSI Indicator
This indicator is a combination of MACD and RSI into one. This is perfect fusion and powerful indicator ever.
Time Marker
CaptraTimeMarker: Marks key trading hours with lines & labels, plus daily separators for cTrader. Customizable & precise
Indicador
EURUSD
Compare Symbol
Plots chosen symbol's close price, candlestick (wick, body) on cTrader chart, supports multiple timeframes.
Indicador
Indices
Commodities
Forex
+2
Two Candle Patterns
Detect powerful 2-candle reversal patterns at key highs/lows. Boost entries with real-time alerts and visual signals.
Indicador
RSI
Breakout
XAUUSD
+5
Shielded Trend
Buy/Sell signals filtering noise, color-coded trends & strength shield 🛡️. Trade only with POWER ⚡
Indicatore utbot
L'indicatore UTBot è uno strumento di analisi tecnica che crea una linea di trailing stop dinamica basata sull'ATRT
Volume-Powered Market Flow Projector
Project market behavior by integrating price and volume data across multiple time dimensions
Indicador
ATR
Supertrend
supertrend
Supertrend Indicator for cTrader
Indicador
NAS100
Indices
Breakout
+6
All-in-One Session Levels Suite
Institutional Session Levels Pro OHLC,Prev(D,W,M OHLC)
ZigZag Price Liquidity Projection
📊 ZigZag Liquidity Projection: Predict bounces/breaks using pivots, ATR & volume.
Moving Average Plus
10 configurable moving averages: choose type, period, color per line; single price source for all.
Indicador
Breakout
ORB v1
Opening Range Breakout (ORB) - Visual Edition
Renko Moving Average Cross Indicator
The Renko Moving Average Cross indicator combines classic EMA crossover signals with Renko-filtered prices.
SupertrendChannels
Supertrend-based channel for entries, trailing stops, and dynamic support/resistance zones.
Open Trade PipsV1
This indicator tracks the unrealised amount of pips in your open positions.
R S
This indicator is a simple, single-timeframe tool for showing candle sentiment directly on your chart. If you want a mor
Indicador
RSI
Breakout
Supertrend
Adaptive Trend Channel
📊 Visualize market trends more clearly and dynamically
Indicador
VWAP
RSI
XAUUSD
+9
Turtle Soup ICT Strategy
Turtle Soup ICT Strategy – Detect liquidity traps & trade smart money moves with precision on cTrader.