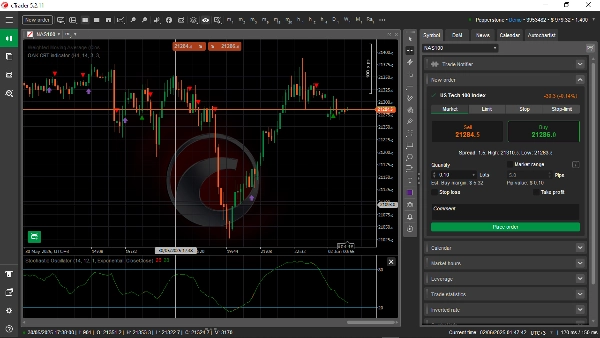
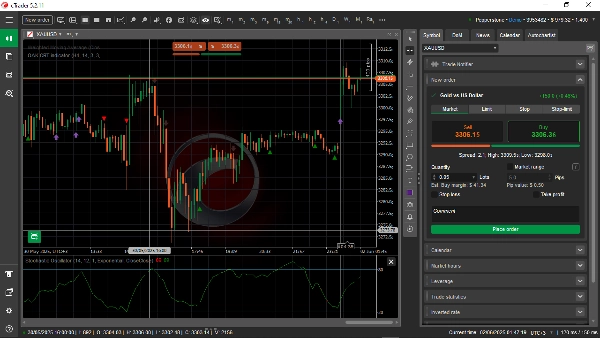
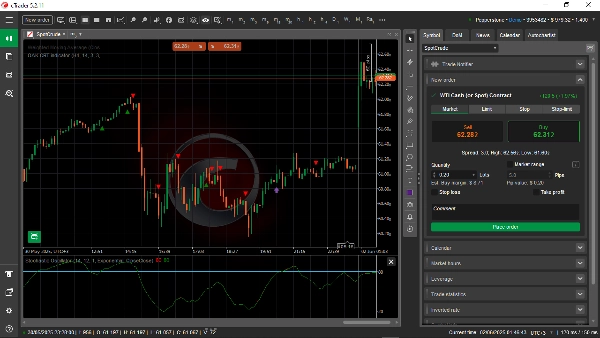
OAK
Индикатор
Версия 1.0, Jun 2025
Windows, Mac
Загруженное изображение продукта "OAK"Загруженное изображение продукта "OAK"Загруженное изображение продукта "OAK"
С 24/02/2025
129.1M
Торгуемый объем
53.08K
Выигранные пипы

The OAK CRT is a sophisticated trading indicator designed to identify potential market reversals and continuations by combining a unique price action pattern with higher timeframe analysis of market momentum. It visually represents trading signals directly on the chart using distinct arrows and triangles, distinguishing between strong and weak buy/sell opportunities. The indicator helps traders align with prevailing trends and anticipate shifts, providing clear visual cues for entry and exit points.

Important Disclaimer: This indicator is a tool to assist in trading and should not be considered the sole basis for any trading decisions. Trading involves significant risk, and past performance is not indicative of future results. This information is not financial advice.

Copyright © 2025 Edderek Tech by Adrian Kwach. All rights reserved.

0.0
Отзывы: 0
Отзывы покупателей
У этого продукта еще нет отзывов. Уже попробовали его? Поделитесь впечатлениями!

Вам также может понравиться

cTrader indicator with mini-timeframe candlesticks. Customize timeframe, colors, margins. Perfect for traders.
Индикатор
RSI
Breakout
+1
📊 Liquidation Map: Potential areas where highly leveraged investors might face liquidations.
Real-Time Candlestick Pattern Detection with Custom Alerts & Trend Analysis for cTrader
Индикатор
NAS100
NZDUSD
+16
📊 VWAP with MTF & Dynamic Deviation Bands
A highly customizable and comprehensive VWAP indicator.
Индикатор
Indices
Breakout
+9
Easy trend tool showing price zones and movement patterns with colour signals that change when trends shift direction.
Индикатор
NAS100
Breakout
+11
Universal Renko Overlay. Tick-Accurate Renko Bars Aligned with Futures Contract Specifications.
Индикатор
ZigZag
NAS100
+8
Price Projection Swing Volume maps future paths using swing pivots and Fibonacci ratios. Visual, geometric and precise.!
Stochastic RSI (StochRSI) is a technical indicator used to measure the strength and weakness of the RSI.
Daily Pivot Points plots key support and resistance levels to guide precise trading decisions.
Индикатор
NAS100
NZDUSD
+15
🚀 Adaptive trailing stop that uses logarithmic normalized volatility....
С 24/02/2025
129.1M
Торгуемый объем
53.08K
Выигранные пипы